

Atrial fibrillation is a cardiac rhythm disorder that significantly elevates the risk of stroke as well as stroke severity. Thyroid hormone excess caused by hyperthyroidism is often named as one of the risk factors for atrial fibrillation.
However, it does not require excess thyroid hormone above the reference range to elevate risk of atrial fibrillation. Significant risk exists even within the normal range, and below reference range.
A team of researchers led by Jeffrey L. Anderson published the results of a large study in the Journal of Cardiovascular Electrophysiology, January 2020. They examined the medical charts of 174,914 patients over an average of 7 years. They tabulated their TSH and thyroid hormone tests and incidents of atrial fibrillation (AF).
This is truly a landmark study for one major reason: T3. As they correctly say, the majority of “previous studies did not assess the relationship of levels of free tri‐iodothyronine (FT3), the most potent thyroid hormone, to AF risk.” In research terminology, FT3 represents a potent unmeasured confounding variable in many studies. Neglecting FT3 is like claiming to study a solar system by examining the planets but neglecting the sun. They included the sun. Thank you, Anderson and team!
Many doctors will be surprised at how different the AF risk profiles are for FT3 and FT4. It matters which form of thyroid hormone you’re talking about when you attribute risk to excess thyroid hormone. Do you mean high-normal or excess Free T3 (FT3), or high-normal or excess Free T4 (FT4), or both?
Does it matter where your pituitary TSH hormone falls? Yes, but surprisingly, part of the normal TSH range is associated with more risk than even high or low TSH. Importantly, merely having a “normal” TSH does not reduce the risk of atrial fibrillation, but may increase it.
The data set itself, which I present here in new graphic visualizations, corrects common misconceptions about thyroid hormones, TSH, and AF risk. A powerful lesson from this study is that TSH is not a proxy for FT4 or FT3 risk associations with atrial fibrillation, and neither is FT4 a proxy for FT3 risk.
This article’s suggested applications to thyroid therapy also require extreme caution.
When concluding, the researchers mentioned “important implications, including a redefinition of the normal range and FT4 targets for replacement therapy.”
But a suggestion to isolate one hormone, FT4, as a treatment target can be very dangerous. Naive thyroid therapy interventions can backfire. In some thyroid patients, adjusting the FT4 to achieve a target can easily move their FT3 into the area of highest AF risk.
The best this research can do for thyroid patients today is to release the stranglehold on harmful AF-thyroid-hormone-risk fears and mythologies that stand in the way of T3-T4 combination therapies, and to raise key questions for future research.
The study raises four implications:
- Question thyroid therapy dogma that accepts high-normal FT4 and low FT3
- Quell fear of AF in T3-inclusive therapies
- Measure the most vital thyroid hormone, FT3
- Conduct research on treated thyroid patients’ AF risk
Analysis of the article’s scientific weaknesses is also crucial. Fortunately, the study’s strengths are worth highlighting, and its weaknesses occur largely beyond the main association data set. These flaws biased the conclusions of the study. I merely list the weaknesses here. Future posts will get into the details and will be more for the advanced readers.
Copyright note
Quotation, paraphrase, and reproduction, annotation, and adaptation of graphs and tables from scientific publications is acceptable within the terms of Canadian and US copyright “fair dealing” and “fair use” for purposes of education and review: See copyright law info
Infographic: Atrial fibrillation facts

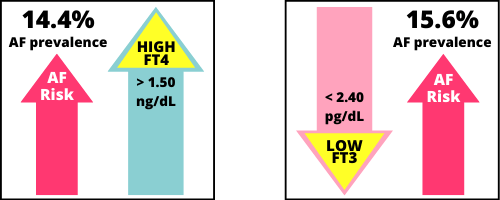
Infographic: Thyroid hormones & atrial fibrillation

The main points in this infographic will be discussed in more detail in this article.
Infographic: Main data on AF prevalence

Notes on methods
1. Reference ranges
The normal reference range values in this study were as follows:
- Free T4 = 0.75 to 1.50 ng/dL
- TSH = 0.54 to 6.80 mcIU/L*
- Free T3 = 2.40 to 4.20 pg/dL
*Before 2017, the reference range had an upper limit of 4.67 mcIU/L.
2. Quartile divisions (Q1-Q4)
The “Percent of reference” vs. “1/4 of lab results” can be visualized graphically:

As one can see,
- Approximately 3/4 of the population had values in the lower half of the ranges.
- Quartile widths were highly skewed, with Q4 taking up approximately 1/2 of the reference range for each hormone.
- Each set of quartiles for FT4, TSH, and FT3 had a slightly different coverage of the normal reference range and
- A different portion of the population was above and below reference on each of the hormones — click to reveal “Population characteristics” below.
For advanced readers: How quartile divisions (Q1-Q4) were determined
Some studies divide the normal reference ranges into approximately even segments (Gullo et al, 2011). However, Anderson and team chose to define quartiles as quarters of the data set.
The researchers did not explain their method, but it can be deduced from the tables and by common research practice — by looking at similar articles that use tertiles (3 groups), quartiles (4 groups), or quintiles (5 groups).
When patients’ values are arranged from lowest to highest, the 25% of the lab values at the lowest end the normal range would define the boundaries of Q1, and so on.
Here are the lab values Anderson’s team provided for each quartile:
| Quartile | Segment of lab results | Free T4 (ng/dL) | TSH (IU/mL) | Free T3 (pg/dL) |
|---|---|---|---|---|
| Q1 | Lowest 1/4 | 0.75‐0.90 (21% of range) | 0.54‐1.30 (12% of range) | 2.40‐2.60* (17% of range) |
| Q2 | Next 1/4 | 0.91‐1.01 (15% of range) | 1.31‐2.04 (12% of range) | 2.70‐2.80* (11% of range) |
| Q3 | Next 1/4 | 1.02‐1.14 (17% of range) | 2.05‐3.68 (26% of range) | 2.90‐3.10* (17% of range) |
| Q4 | Highest 1/4 | 1.15‐1.50 (47% of range) | 3.69‐6.80 (50% of range) | 3.20‐4.20 (56% of range) |
*Note: When calculating “% of range” for FT3, one must include the 0.09 gap between each quartile, i.e. 2.40-2.69, 2.70-2.89, 2.90-3.19, to obtain values whose sum is 100% of range.
Population distributions are often skewed. Therefore, skewed reference quartiles are common to many studies of risk association (See for example, Kim et al, 2016, which has unevenly distributed quartiles within reference range).
However, this particular division into quartiles (rather than tertiles or quintiles) led to some weaknesses in the analysis of data when odds ratios (ORs) and hazard ratios (HRs) were calculated. I will discuss these weaknesses in a future post.
Population characteristics: Age, sex, normal vs. high or low TSH, FT3, FT4
The population was drawn from Intermountain Healthcare system in the United States, including “22 hospitals, 185 clinics, and a system of health insurance plans within Utah and portions of its surrounding states.”
Only adults over 18 years of age were included if they had a Free T4 laboratory test between April 1999 and May 2018, and their first FT4 level became their “baseline” level at “study entry.”
The average age of patients was 64.0 ± 11.2 years
64.9% of the study population were women.
Only the portion of the study population “not taking thyroid hormones at baseline” was included in the main data set whose associations were calculated in tables (shown above).
A brief, secondary analysis was conducted on the population that was already undergoing levothyroxine treatment (see “Thyroid therapy implications” section below). No other thyroid treatment modalities were included.
The population’s TSH and FT3 levels were also included in the study if they were measured within 60 days of the FT4 at study entry.
- There was an average of 0.6 ± 3.7 days between the FT4 and TSH tests, and
- an average of 1.46 ± 7.78 days between the FT4 and the FT3 test.
No subsequent thyroid hormone tests were entered into the study.
The study population was large enough to provide significant data sets for values below, within, and above reference range.
| Free T4 | TSH | Free T3 | |
|---|---|---|---|
| n = | 174,914 | 147,824 | 26,524 |
| Low | 7.4% | 22.8% | 15.0% |
| Normal | 88.4% | 70.0% | 79.9% |
| High | 4.2% | 7.2% | 5.1% |
Percentage of patients with low, normal, and high levels.
As you can see, 30% of the population had TSH measurements that fell outside of the reference range at baseline.
One question unanswered in this study was “How many patients with subclinical or overt hypo/hyper diagnoses were soon placed on thyroid therapy?”
It is vital to consider how intervening thyroid therapy could have influenced the 3-year and long term incidence rate for AF. (See “weaknesses of the study” section, below.)
Key messages from the prevalence data
These are the “take home” lessons about each hormone: FT3, TSH and FT4.
The associations between thyroid hormone levels and AF at baseline or “study entry” called “Prevalent AF,” have the most reliable data despite their raw, unadjusted nature.
These were rates of people with AF diagnoses at the time of study entry when the hormone levels were recorded.
However, these are the raw, basic rates in the study population before adjustment for age (64 ± 11.2 years) and sex (64.9% female), so keep these two biases toward older age and female sex in mind.
The AF prevalence data also shows rates before researchers chose to “adjust” the rates for the presence of many cardiovascular disorders that can worsen the effect of thyroid hormone levels on AF. (Methodological biases and weaknesses arose later with such adjustments; see weaknesses list below.)
Free T3
Low Free T3 (below reference range) had the highest prevalence of AF, at 15.6%. Unfortunately, many patients in the study population were in this hormone category, since 15% of the study population had a low FT3.

“Low T3 syndrome” or “nonthyroidal illness syndrome” (NTIS) is a well known thyroid metabolic shift that often occurs in severe illness or physical trauma. The human body elevates deiodinase type 3 (D3) which swiftly converts both T3 and T4 to their inactive metabolites while TSH is not elevated, and inflammatory cytokines also hinder D1 and D2 enzymes that convert thyroid hormones. This can result in swift and often severe loss of T3 hormone.
Why have I mentioned “avoid chronic low FT3” in the meme above? The distinction between “acute” and “chronic” low FT3 likely matters for AF incidence and severity, just as it does for many other cardiovascular disorders. Whereas the early “acute” phase of low T3 is difficult to avoid or minimize without pre-surgical treatment with T3 hormone (Wang et al, 2018), failure to recover normal circulating T3 from a TSH-stimulated thyroid gland results in a metabolically distinctive condition of “chronic NTIS.” Chronic low T3 is now recognized to be pathological in many ways (van den Berg et al, 2014).
Free T4
High Free T4 (above reference range) had the second highest prevalence of AF, at 14.4%.
High-normal Free T4 (Q4, upper 47% of range) had the fourth-highest rate of prevalence, at 12.6%.

Even though high-normal FT4 had the 4th highest prevalence rate, this was the quartile that the researchers chose to emphasize in their study. Unfortunately, their statistical methods amplified the FT4 hormone’s linear trend more than the stronger U-shaped trend of FT3. (This is a weakness of the study, mentioned below.)
High-normal TSH (Q4, upper 50% of range) had the third-highest prevalence rate, at 13.7%, and High TSH was not far behind at 13.5%.

Merely having a “Normal” TSH is not protective; it does not reduce AF prevalence. A high TSH was more strongly associated with AF than a low TSH (11.8%).
The similar rates of prevalence in the two higher TSH categories (13.7, 13.5%) also imply that 6.80 mU/L is not a physiologically meaningful boundary for AF risk, while all other levels of TSH were significantly different in their prevalence rates.
Indeed, the interpretation of the TSH reference range in this data set changed in 2017, the previous upper boundary being 4.67 mU/L in the prior years within the study. (Unquestioning adherence to reference range boundaries is a weakness of the study, listed below.)
Normal and high FT3 are NOT associated with AF prevalence.

- High FT3 had a weaker AF association (7.9%) than the lowest risk quartile for TSH (8.4%) and FT4 (8.7).
- High-normal Free T3 (Q4, upper 56% of range) had the lowest AF prevalence rate among all quartiles of all hormones, with only 3.9% of patients in this quartile having AF at baseline.
Free T3 and Free T4 had contrasting AF associations.
- As FT4 rises higher, the percentage of AF association increases, and
- As FT3 fall lower, the percentage of AF association also increases.
Theoretically, a person with higher FT4 and low FT3 would have the highest combined risk, and vice versa. However, individuals’ FT3:FT4 hormone ratios were not calculated in this study, although they could have been calculated for 26,524 people during data entry. (See study weaknesses below.)
The summary table shows which hormone levels had the strongest and weakest associations with AF:
| Association with AF | Free T4 | TSH | Free T3 |
|---|---|---|---|
| Strongest | High FT4 (above range) | Q4 TSH (Upper 50% of range) | Low FT3 (below range) |
| Weakest | Q1 FT4 (Lowest 21% of range Q1) | Q2 TSH (12-24% of range) | Q4 FT3 Upper 56% of range) |
Line graphs: AF prevalence & 3-year incident
When presented as line graphs, one sees the data through a different lens.
You can see the “U-shaped” association pattern in part of the TSH line (gray) and the Free T3 line (pink), where the association with AF rises at the extremes of low and high hormone concentrations.

The differences between AF prevalence and 3 year incident AF
The 3 year incident rates are lower simply because there is less chance of AF being diagnosed within a 3-year period compared to being diagnosed with AF during one’s lifetime before study entry.
- AF prevalence: Out of the 174,914 people, 40,884 (23.4%) patients had AF at study entry. This yielded “AF prevalence” rates between 3.9% and 15.6% within each hormone level.
- 3 year incident AF: After the AF Prevalence rates were calculated, the remaining 134,030 patients’ records who did NOT have AF at study entry were examined to see if they had had an AF incident within 3 years after study entry. This yielded “3 year incident AF” rates between 2.2% and 5.7% within each hormone level.
The 3 year incident rates are not as trustworthy. First of all, a person’s health may have changed in 3 years, especially if many recovered from the high-risk condition of “nonthyroidal illness” while others fell into this condition. Secondly, 30% of the records at study entry had a TSH either below or above reference (see “population characteristics” section above). Therefore, up to 30% of the main study population could have been diagnosed with a thyroid disorder soon after this set of laboratory tests. They could have been immediately treated with thyroid hormones (if hypo) or anti-thyroid medications (if hyper), and all three hormone levels would change as their doses were adjusted over three years. Only one set of hormone measurements was included per person.
Anderson et al’s analysis of treated thyroid patients
The brief analysis of FT4, TSH, and FT3 levels within the subgroup of patients on levothyroxine therapy at study entry revealed similar FT4 relationships to the rest of the data set, but concealed much of interest and relevance.
In the brief section that analyzed the patients who were on levothyroxine (L-thyroxine, LT4) therapy at the time of study entry (a subclass excluded from the main data set), they wrote:
“The Intermountain EDW identified 37 288 patients taking L‐thyroxine at the time of fT4 determination.
These patients were excluded from the primary study cohort because of potential confounding by treatment of the relationship of AF with intrinsic hormone balance.
Their age averaged 64.6 ± 11.7 years, and 76.4% were women.
As with untreated subjects, the multivariable odds ratio of prevalent AF increased incrementally across the normal range of fT4, with an adjusted OR of 1.24, P < .001, for Q4 compared to Q1.
Prevalence increased further with high fT4 levels (OR, 1.33, P < .0001).
In contrast, no relationship between initial fT4 category and incident AF was noted (Q4/Q1 adjusted HR 0.97, P = .62).
Adding those on thyroxine to those not taking thyroxine at baseline resulted in a total fT4 population of 212 202 and gave similar results for the association of fT4 with AF as those of the primary study population (data not shown).”
Anderson et al, 2020
This is the full extent of their analysis of this subclass of 37,288 people!
As one can see,
- The researchers only chose to talk about FT4 hormone in this class of patients. They did not mention Low T3 or High T3 or TSH.
- They do not provide the raw prevalence rates for AF. None of the appendices provides data for this population “(data not shown).” Please show it in a future study and analyze it. It is utterly unethical for researchers to continue to neglect our population in their health association data sets.
- The research team implicitly imposed the undosed population’s hormone quartiles on the LT4-dosed population as they calculated odds ratio (OR) and hazard ratio (HR) for the treated subgroup. However, we know that LT4 dosed thyroid patients have a significantly higher FT4 and lower FT3 than the healthy population mean. (Gullo et al, 2011). The treated patient population deserves their own quartile divisions before calculating odds ratios and hazard ratios.
These are all weaknesses of the study’s treatment of LT4-treated patients to add to the list below. Clearly, this cursory analysis can’t tell the whole story.
It is a very poor basis for the research team to raise the topic of “implications” for thyroid therapy.
One cannot simply enact a policy of avoiding high-normal FT4 levels in treated patients based on this article’s title and conclusions for the untreated and/or the treated population.
It could be dangerous to lower FT4 levels in people treated with standard T4 monotherapy.
Doing so can cause the most vulnerable of poor T4-T3 converters to fall into cohorts with even higher rates of AF prevalence: Low T3 and Higher-normal TSH.
Anderson and team acknowledged the limitations, in general, in their conclusion, and it needs to be amplified as a warning:
“should physicians take care to avoid achieving an fT4 in the upper range of normal when providing thyroid replacement medication for overt or subclinical hypothyroidism, and should TSH monitoring be downgraded?
Unfortunately, observational studies, including our own, cannot establish causal relationships or provide definitive answers to these questions.
Thus, before firm clinical recommendations can be made, interventional studies, ideally including randomized interventional trials, are needed.
However, our observations do provide an impetus to move beyond a primary or exclusive focus on TSH to one including fT4.“
Indeed, I would wholeheartedly agree that thyroid science as a whole must “move beyond a primary or exclusive focus on TSH to one including fT4”
… but how could you once again fail to mention FT3? It’s the most vital and powerful thyroid hormone, and its Low T3 vs. Normal Q4 will have the highest ORs and HRs of all (not calculated in this article).
Implication #1: Question thyroid therapy dogma
Click to open this section
Anderson et al’s 2020 article provides yet another basis for questioning the norms promoted by American Thyroid Association thyroid therapy guidelines published in 2012 and 2014.
- LT4 monotherapy’s induction of a high-normal FT4 above the population mean has often been excused as benign and even necessary for health.
- A chronically low or low-normal FT3 has often been considered acceptable and even inevitable in a fraction of patients, and claimed ignorance about the health outcomes of FT3:FT4 ratios has been used as a shield to maintain the status quo.
- The biochemical target of a normalized TSH has been upheld as a target for therapy. This target is based on the core presumption that the sensitivity of pituitary response makes TSH an accurate proxy for tissue T3 sufficiency in all organs and tissues despite the unnatural conditions of thyroid loss and dosing.
For example, the 2012 guidelines (Garber et al, 2012, ATA/AACE Guidelines for hypothyroidism) promote treatment targets that could confer significant AF risk according to Anderson’ study. They say
- “When serum TSH is within the normal range, free T4 will also be in the normal range.”
- They fail to mention that FT4 will usually be significantly higher than the average population. LT4 therapy is well known to elevate FT4 above the population mean and into the upper third to quarter of reference range, or even above reference range (Gullo et al, 2011).
- “On the other hand, T3 levels may be in the lower reference range and occasionally mildly subnormal.”
- It is absolutely shocking that medically-induced low T3 levels are treated with such disregard and neglect.
As another example, the 2014 ATA “Guidelines for the treatment of hypothyroidism” (Jonklaas et al) say,
- “The significance of perturbations in serum triiodothyronine concentrations within the reference range or of mildly low serum triiodothyronine concentrations is unknown.” … “Direct evidence addressing the question of whether small decrements in plasma T3 have clinically important sequelae is lacking.”
- “Patients with hypothyroidism treated with levothyroxine to achieve normal serum TSH values may have serum triiodothyronine concentrations that are at the lower end of the reference range, or even below the reference range. The clinical significance of this is unknown.”
This dogma must be questioned.
The shameful claim of ignorance must be replaced with knowledge.
Prohibiting the routine dosing of a bioidentical human hormone (T3) is a policy weakly based on long-standing ignorance and fear.
Implication #2: Quell fear of AF in T3-inclusive therapies
Click to open this section
Anderson and team’s studies ought to quell fears of T3 fluctuations and “excursions” within and beyond the reference range.
Combination thyroid therapy trials have been plagued with expressions of fear, concern, and even implied blame of a suppressed TSH or high FT3 causing atrial fibrillation or other arrhythmias when T3 hormone is being dosed. This is in comparison to the perceived safety of LT4 monotherapy which lowers FT3 in many people.
In the 2012 European guidelines for T3-T4 combination therapy, the authors recommended excluding thyroid patients with arrhythmias from individual therapy trials under the supervision of an endocrinologist, because
“The increase of serum free T3 may provoke cardiac arrhythmias in susceptible patients.”
(Wiersinga et al, 2012)
Why may it do so? Because many people have feared that it can. And when fear is expressed over and over in scientific articles’ conclusions, it seems to feel real, even if it is unexamined.
Studies have long expressed fears of atrial fibrillation risk attributed to low TSH and T3 dosing. One of the clinical trials of combination therapy reviewed by Escobar-Morreale and team in 2005 was Siegmund et al’s trial.
One patient out of 26 withdrew from the study due to an incident of atrial fibrillation. The reviewers pointed to TSH suppression and the incorporation of T3 dosing, rather than suspecting a preexisting condition or the concurrent FT4 levels:
“Of note, one of the three patients not completing the study was removed during levothyroxine plus liothyronine combination treatment because of atrial fibrillation associated with suppression of TSH.
The occurrence of this severe adverse event raises a cautionary note regarding the addition to levothyroxine of even very small quantities of liothyronine.”
(Escobar-Morreale et al, 2005)
In this passage, one person’s “severe adverse event” was twisted and overblown into a moral lesson about the dangers of “small quantities of liothyronine (T3)” hormone dosing — irrespective of the baseline FT3 before dosing T3, or the concurrent FT4 level, or the person’s existing risk of AF when entering the study.
The assumed safety of standard thyroid treatment and the normalization of TSH reference has long been the implication of many such fearmongering conclusions about AF incidents in T3-based therapy.
Today, given that Anderson’s 2020 study found Low T3 levels are the highest association with AF prevalence one should ask:
“What if the patient’s FT3 fell too low by 12-24 hours post dose, inducing arrhythmia from the long FT3 valley, rather than the transient FT3 post-dose peak?”
Today, given that Anderson’s 2020 study found high and high-normal FT4 levels with high associations with AF risk, it would be more reasonable to point the finger at FT4.
“How might the patient’s high-normal FT4 on T4 monotherapy have weakened the cardiovascular system before entry into the trial?”
Moreover, during the therapy trial, the average of the entire cohort had a moderately high Free T4 that was not significantly reduced when T3 was incorporated into therapy. One should not simply add T3 without accommodating it in all patients, or one risks merely adding more T3 on top of the patients’ current T4-T3 conversion rate.
In light of Anderson’s 2020 study, we should know that AF risk is not diminished whenever TSH is within the reference range. AF association was highest in the fourth quartile of TSH.
The falsely simplistic and dualistic belief that normal TSH is always protective and low TSH is always dangerous during thyroid therapy has often led to an unreasonable degree of panic. The extreme panic is unwarranted whenever TSH is lowered while FT4 and FT3 remain normal (subclinical hyperthyroidism) during thyroid therapy. Looking at Siegmund et al’s 2004 study directly, the team reported the patient had atrial fibrillation
“with absolute arrhythmia in association with TSH suppression below zero.”
This is a statement which reeks of exaggeration. It is impossible to have a TSH below zero. But why was the TSH suppressed? What were the TSH receptor stimulating antibody levels concurrent with this suppression? Not measured or mentioned. The TSH suppression and the arrhythmia are presumed to be enough of a coincidence to inspire undue fear of dosing a hormone a healthy thyroid secretes every night in larger quantities than during the day.
Implication #3: Measure the most vital thyroid hormone, FT3
Click to open this section
Studies like these demonstrate that neither TSH nor FT4 are predictors or proxies for FT3 for cardiovascular risks like atrial fibrillation.
Yet so many thyroid health risk studies have attempted to associate a low or high TSH level or FT4 levels while blinding themselves to FT3.
Some measure Total T3 instead. You can’t make a physiologically meaningful ratio out of Free T4 and Total T3, it’s like comparing Total T4 to Free T3 during pregnancy. Variations in binding proteins matter. Both are bound 75% to thyroxine binding globulin (TBG), but T3 is 20% bound to albumin, and T4 is only 5% bound to albumin.
This practice of ignoring Free T3 must be more harshly criticized in future.
There is no excuse to avoid gathering FT3 data in health risk studies both in the untreated population and those treated with thyroid hormones or anti-thyroid medications.
Of what use is a study that fails to assess thyroid hormone levels and health risk if it fails to measure the most powerful thyroid hormone?
Myths about poor FT3 assay quality are no excuse. Research by international bodies have long since proven that our contemporary FT3 immunoassays are of equal precision and reliability as the FT4, and sometimes the FT3 is of better accuracy than the FT4. The remaining work to be done is to calibrate these tests to the international standard, the LCMS assay, with the aim of improving comparability of results obtained between manufacturers (Thienpont et al, 2010). In the studies that do report their assay’s performance, FT3 is usually just as reliable and precise as FT4 and sometimes even better.
Contrary to popular myths of FT3 variability, the FT3 hormone level is extremely stable in LT4 monotherapy, and outside of therapy. FT3 circadian rhythm is predictable, and the variation of this hormone every hour or two is far narrower than the variation of TSH and almost equivalent to FT4 during laboratory hours (Russell et al, 2008).
In fact, FT3’s incredible stability over days, weeks and months in healthy individuals (Ankrah-Tetteh et al, 2008) means that plasma T3 stabilization is a major target of the entire HPT axis (Abdalla & Bianco et al, 2014). FT3 destabilization is seen in disease and recovery phases.
Especially in T3-treated thyroid patients, measuring FT3 is crucial: In patients that dose T3 hormone, the FT3 peak and clearance are entirely predictable. One can easily control the timing of the laboratory test. In any study involving T3 dosing, the “hours since last dose” must be reported, and conclusions cannot be drawn based on the height of the transient post-dose peak alone.
Implication #4: Conduct research on treated thyroid patients’ AF risk
Click to open this section
The conjunction of AF and thyroid disease in the older female population means that this demographic is highly important to study. As stated in the introduction to the article,
“AF is somewhat more prevalent in men, but its adverse consequences are greater in women.”
- Among the untreated patients, only 64.9% were women.
- Among the treated patients, 76% were women.
- Among those with low FT3, the category with the highest AF prevalence rate, 70.9% were women.
- Among those with high-normal FT4, the fourth-highest AF prevalence rate, 77.2% were women.
Age:
- The Low FT3 category, the highest had an average age of 65.5 years.
- Meanwhile, the Normal Q4 FT3 quartile, with the lowest AF prevalence rate of all, had the youngest average of 58.3 years
- The Normal Q4 TSH category, which had the third-highest AF prevalence rate, had the oldest average of 66.6 years.
Neglecting to assess our AF risk from low FT3 and high-normal FT4 while we are on standard LT4 thyroid therapy is medically ageist and sexist and could be very costly for our medical systems.
One has to do the research respectfully, or it could do more harm than good. In future research on treated thyroid patients, the AF risks and benefits of various thyroid therapy modalities will only be evident when research methods are sensitive to the treated population’s uniqueness and diversity.
Emerging research on treated thyroid patients shows how inappropriate it is to study FT3, FT4 and TSH in isolation from each other. Hormone dosing itself powerfully distorts these hormones’ natural relationships, as does thyroid gland status, pituitary dysfunction, and TSH receptor antibodies.
The FT3:FT4 ratio is an essential variable in research on thyroid hormone health outcomes whether a person is treated or not. But the TSH relationship to this vital ratio has been misunderstood as being normal. Many treated patients’ TSH-FT3-FT4 hormone configurations are impossible to obtain in the untreated human body with a healthy thyroid. The TSH-T3 disjoint is real in LT4 monotherapy. A TSH-T4 disjoint also exists in T3-dominant therapies. Ratios are crucial.
Long term studies can be done via retrospective and prospective cohort studies like these. They don’t have to be therapy trials! However, they can investigate diverse therapy ratios that yield different hormone ratios in blood. One can include the health records of some people already on long-term desiccated thyroid therapy and T3 monotherapy and analyze them separately.
Several motivations ought to inspire researchers to study the thyroid-hormone treated population:
First, we are the population most vulnerable to medication-induced health risks for atrial fibrillation and its attendant disorders such as stroke. Women are at higher risk of both thyroid disease and worsened stroke outcomes. We have been neglected by reason of our complexity, but we deserve study because of our risk.
Second, our thyroid hormone and TSH levels are subject to direct manipulation by dosing, making our real-life therapy examples of extremes. It is easy to focus on subgroups with chronic low FT3:FT4 ratios that are not always induced by nonthyroidal illness, but by poor T4-T3 conversion during T4 monotherapy. Truly comparative studies can contrast these patients with patients who have the opposite higher FT3:FT4 ratios while on long-term T3-T4 combination therapy, desiccated thyroid therapy, and even long-term T3 monotherapy.
Third, by providing many subjects with total thyroidectomies, fully atrophied thyroids, deiodinase polymorphisms, TSHR gene polymorphisms, and TSH-receptor antibodies, our population can provide insights into signaling pathways in cardiology that one cannot study in the healthy-thyroid population. Our antibodies and polymorphisms create unique test cases.
Instead of using the study of untreated populations to dictate the therapy of treated individuals, let’s turn the tables and ask this question:
“How can health-risk studies and therapy experiments in the thyroid-disabled population lead to insights and innovative therapies for the larger thyroid-healthy population at risk of atrial fibrillation?”
Strengths of Anderson et al’s study
The unquestionable strengths of the study are:
- Its inclusion of FT3 hormone measurement, since this is the most powerful thyroid hormone. It has been ignored in too many studies of this nature, causing many to misattribute unique FT3 health risks to FT4 and TSH levels.
- Its large sample size, even for the FT3 hormone measurement. Nobody can claim that a data set of even 26,524 FT3 measurements is “underpowered,” even if it was much smaller in size than 174,914 patients with FT4 measurements.
- The major insights one can deduce from the main AF Prevalence table before adjustment, and
- The frequency rates of other cardiovascular diagnoses in the population studied according to the hormone quartiles they established (see Prevalence rates for 10 chronic disorders at various FT4, TSH and FT3 levels).
Weaknesses of Anderson et al’s study
These weaknesses are more for advanced scientific readers. They deserve discussion in a separate post.
Click to reveal the list of research weaknesses
Missing the opportunity to compute FT3:FT4 ratios and enter them into the data set for the 26,524 patients for whom they were available, and blindness to this ratio as a core variable. We can only hope that the researchers will do this in a future article.
Presuming that laboratory reference range boundaries are physiologically significant, and making them define the outer boundaries of quartiles 1 and 4, rather than dividing their entire data set into quintiles as seen in Wei et al, 2018. The tendency to over-rely on quartiles and quintiles has drawbacks (Bennette & Vickers, 2012). There are significant benefits of performing analysis on thyroid hormones as continuous variables, as was done by Martin et al, 2017.
The 3-year Predictive fallacy. Making risk predictions based on one set of entry hormone measurements is difficult, given “nonthyroidal illness” that could have been resolved or remained chronic, and patients being placed on thyroid therapy during the intervening years before AF incidence. More hormone measurements and therapy records are needed during the term of the study.
Grouping together of TSH-FT4 defined categories of euthyroid, hypothyroid, and hyperthyroid patients into a single “thyroid hormone disorders subset” that could not distinguish between outcomes of hormone levels within these diverse diagnostic categories. For example, if it is true that “Clinically overt hyperthyroidism is … associated with a 20% increased mortality risk and a 65% increased risk of cardiovascular events” (Dekkers et al, 2017), then why allow the hyperthyroid population’s data to cloud the FT3 risk association results for euthyroid and hypothyroid patients?
Overadjustment bias and unnecessary adjustment. In many cases, a concurrent medical condition (listed in appendices) may be a powerful mediating variable between thyroid hormone levels and AF incidence and severity, not a truly “confounding” variable. Provide several adjustment scenarios and list all confounding variables used in adjustment. (See Schisterman, Cole & Platt, 2009)
Forcing a conventional linear regression model on a U-shaped risk. Many variables in cardiology may have linear relationships to health outcomes, but thyroid hormones do not. Thyroid hormones, especially FT3, have a tendency toward balance and homeostasis and many cardiovascular disorders can be triggered or worsened by both thyroid hormone excess and its deficiency. The reference quartile or quintile should not be Q1, but rather the category that contains the hormone level’s median or mean for the population. See Wei et al, 2018. Because of the reliance on Q1, the highest hazard ratio for FT3 (between Low T3 and Q4) was uncalculated and neglected in this study.
Review conclusions
Anderson and team have done an important service by compiling a data set that has the power to change incorrect assumptions about FT3, FT4 and TSH health risk.
- Their research exonerates isolated high-normal and high FT3 hormone levels from unjust blame in causing or triggering AF. This hormone has the least risk of all three hormones at its upper end of range.
- It reinforces the fact that having a normal TSH does little to minimize health risks such as atrial fibrillation. It’s not good enough merely to normalize TSH.
- It inspires further research on what may cause the risk of AF associated with high-normal FT4: What is going on at the molecular level in T4’s non-genomic signaling pathway that is so different from T3’s genomic signaling in the nucleus?
Far more can be done with this kind of data set. It would be helpful to analyze it using different methods and more metabolically appropriate presumptions. How refreshing it would be to see studies of FT3, FT4 and TSH as variables of risk
- that do not take for granted statistical reference ranges and diagnostic traditions,
- that do not merely hunt for linear trends but respect U-shaped risk patterns,
- that do not separate interrelated hormones from each other but calculate ratios and examine them as variables,
- that do not devise statistical methods to overemphasize the fourth-strongest prevalence rate, and
- are not neglectful of the cardioprotective power of T3 hormone and its metabolites but discuss the reasons why having high-normal FT3 levels can be healthier and reduce risk.
Finally, it would be helpful to avoid the temptation to imply that descriptive statistics of untreated individuals could ever become simple single-hormone prescriptive therapy targets for treated patients.
Research using different methods is urgently needed on treated thyroid patients. We are the people who are most vulnerable to medication-induced AF risk from our thyroid hormone ratios. We are commonly excluded from such studies as these because of our complexity.
Who has the moral courage and scientific acuity to embrace our complexity?
The neglect of the treated population’s unique thyroid hormone ratios leaves many fields of medicine, not just cardiology, with incorrect and simplistic assumptions about the risks and benefits of various thyroid therapies and hormone concentrations. It’s as important to stop this neglect as it is to conduct research carefully on this vulnerable population.
Researchers, it’s time to get to work on studies of long-term health outcomes in treated thyroid patients who have been living with unusual and extreme FT3:FT4 ratios in blood. Compare therapy approaches and thyroid disease etiologies in your studies.
The benefits of well-designed studies of thyroid hormone and AF risk may reach beyond treated thyroid patients. Even those who do not suffer thyroid disorders may benefit from adaptive thyroid hormone mitigation of their AF risk profile, inspired by mitigation studies performed first in the population already undergoing thyroid therapy.
See the next article discussing Anderson et al’s appendix data set:
Prevalence rates for 10 chronic disorders at various FT4, TSH and FT3 levels
References
Click to reveal reference list
Abdalla, S. M., & Bianco, A. C. (2014). Defending plasma T3 is a biological priority. Clinical Endocrinology, 81(5), 633–641. https://doi.org/10.1111/cen.12538
Anderson, J. L., Jacobs, V., May, H. T., Bair, T. L., Benowitz, B. A., Lappe, D. L., Muhlestein, J. B., Knowlton, K. U., & Bunch, T. J. (2020). Free thyroxine within the normal reference range predicts risk of atrial fibrillation. Journal of Cardiovascular Electrophysiology, 31(1), 18–29. https://doi.org/10.1111/jce.14183
Ankrah-Tetteh, T., Wijeratne, S., & Swaminathan, R. (2008). Intraindividual variation in serum thyroid hormones, parathyroid hormone and insulin-like growth factor-1. Annals of Clinical Biochemistry, 45(Pt 2), 167–169. https://doi.org/10.1258/acb.2007.007103
Bennette, C., & Vickers, A. (2012). Against quantiles: Categorization of continuous variables in epidemiologic research, and its discontents. BMC Medical Research Methodology, 12(1), 21. https://doi.org/10.1186/1471-2288-12-21
Dekkers, O. M., Horváth-Puhó, E., Cannegieter, S. C., Vandenbroucke, J. P., Sørensen, H. T., & Jørgensen, J. O. L. (2017). Acute cardiovascular events and all-cause mortality in patients with hyperthyroidism: A population-based cohort study. European Journal of Endocrinology, 176(1), 1–9. https://doi.org/10.1530/EJE-16-0576
Escobar-Morreale, H. F., Botella-Carretero, J. I., Escobar del Rey, F., & Morreale de Escobar, G. (2005). REVIEW: Treatment of hypothyroidism with combinations of levothyroxine plus liothyronine. The Journal of Clinical Endocrinology and Metabolism, 90(8), 4946–4954. https://doi.org/10.1210/jc.2005-0184
Garber, J. R., Cobin, R. H., Gharib, H., Hennessey, J. V., Klein, I. L., Mechanick, J. I., Pessah-Pollack, R., Singer, P. A., & Woeber, K. A. (2012). Clinical practice guidelines for hypothyroidism in adults: Cosponsored by the American Association of Clinical Endocrinologists and the American Thyroid Association. Endocrine Practice, 18(6), 988–1028. https://doi.org/10.4158/EP12280.GL
Gullo, D., Latina, A., Frasca, F., Le Moli, R., Pellegriti, G., & Vigneri, R. (2011). Levothyroxine Monotherapy Cannot Guarantee Euthyroidism in All Athyreotic Patients. PLoS ONE, 6(8). https://doi.org/10.1371/journal.pone.0022552
Jonklaas, J., Bianco, A. C., Bauer, A. J., Burman, K. D., Cappola, A. R., Celi, F. S., Cooper, D. S., Kim, B. W., Peeters, R. P., Rosenthal, M. S., & Sawka, A. M. (2014). Guidelines for the Treatment of Hypothyroidism: Prepared by the American Thyroid Association Task Force on Thyroid Hormone Replacement. Thyroid, 24(12), 1670–1751. https://doi.org/10.1089/thy.2014.0028
Kim, H. J., Bae, J. C., Park, H. K., Byun, D. W., Suh, K., Yoo, M. H., Kim, J. H., Min, Y. K., Kim, S. W., & Chung, J. H. (2016). Triiodothyronine Levels Are Independently Associated with Metabolic Syndrome in Euthyroid Middle-Aged Subjects. Endocrinology and Metabolism (Seoul, Korea), 31(2), 311–319. https://doi.org/10.3803/EnM.2016.31.2.311
Martin, S. S., Daya, N., Lutsey, P. L., Matsushita, K., Fretz, A., McEvoy, J. W., Blumenthal, R. S., Coresh, J., Greenland, P., Kottgen, A., & Selvin, E. (2017). Thyroid Function, Cardiovascular Risk Factors, and Incident Atherosclerotic Cardiovascular Disease: The Atherosclerosis Risk in Communities (ARIC) Study. The Journal of Clinical Endocrinology and Metabolism, 102(9), 3306–3315. https://doi.org/10.1210/jc.2017-00986
Russell, W., Harrison, R. F., Smith, N., Darzy, K., Shalet, S., Weetman, A. P., & Ross, R. J. (2008). Free Triiodothyronine Has a Distinct Circadian Rhythm That Is Delayed but Parallels Thyrotropin Levels. The Journal of Clinical Endocrinology & Metabolism, 93(6), 2300–2306. https://doi.org/10.1210/jc.2007-2674
Schisterman, E. F., Cole, S. R., & Platt, R. W. (2009). Overadjustment Bias and Unnecessary Adjustment in Epidemiologic Studies. Epidemiology (Cambridge, Mass.), 20(4), 488–495. https://doi.org/10.1097/EDE.0b013e3181a819a1
Siegmund, W., Spieker, K., Weike, A. I., Giessmann, T., Modess, C., Dabers, T., Kirsch, G., Sänger, E., Engel, G., Hamm, A. O., Nauck, M., & Meng, W. (2004). Replacement therapy with levothyroxine plus triiodothyronine (bioavailable molar ratio 14: 1) is not superior to thyroxine alone to improve well-being and cognitive performance in hypothyroidism. Clinical Endocrinology, 60(6), 750–757. https://doi.org/10.1111/j.1365-2265.2004.02050.x
Thienpont, L. M., Van Uytfanghe, K., Beastall, G., Faix, J. D., Ieiri, T., Miller, W. G., Nelson, J. C., Ronin, C., Ross, H. A., Thijssen, J. H., Toussaint, B., & IFCC Working Group on Standardization of Thyroid Function Tests. (2010). Report of the IFCC Working Group for Standardization of Thyroid Function Tests; part 2: Free thyroxine and free triiodothyronine. Clinical Chemistry, 56(6), 912–920. https://doi.org/10.1373/clinchem.2009.140194
Van den Berghe, G. (2014). Non-thyroidal illness in the ICU: A syndrome with different faces. Thyroid: Official Journal of the American Thyroid Association, 24(10), 1456–1465. https://doi.org/10.1089/thy.2014.0201
Zhang, J.-Q., Yang, Q.-Y., Xue, F.-S., Zhang, W., Yang, G.-Z., Liao, X., & Meng, F.-M. (2018). Preoperative oral thyroid hormones to prevent euthyroid sick syndrome and attenuate myocardial ischemia-reperfusion injury after cardiac surgery with cardiopulmonary bypass in children. Medicine, 97(36). https://doi.org/10.1097/MD.0000000000012100
The fundamental observation of the importance of T3 is, I suspect, unsurprising to many.
A major question is what treatment, if any, is required?
Commonly enough we see beta blockers prescribed. But some (propranolol for one) affects T4 to T3 conversion.
Should we, perhaps, be considering thyroid hormone treatments before other medicines?
Should we be reassessing use of amiodarone and actually asking how it actually works? And what really happens when we see amiodarone induced thyrotoxicosis?
Thank you, these are important questions.
I was prescribed a low dose of bisoprolol, a beta blocker, only for one day before a CT scan, shortly after beginning a transition away from T4 monotherapy (on which my FT3 had been oppressed below reference for the prior 3 years). I was already experiencing a relief from 3 months of incessant daily and nightly random chest pain after having started T3 dosing.
I had extreme side effects from the beta blocker.
It felt like there was a rate limiter on my body movements and I could hardly walk upstairs because my breathing and heart rate could not keep up. It felt like every movement was resisted, like swimming through water instead of air. These were definitely side effects of the bisoprolol because they went away as it left my system.
A few years later, while on stable T3 monotherapy, before having a FT3 blood test, I had the same thing happen after my routine pre-test 12 to 15 hour fast from my T3 dosing.
I could hardly walk. I had difficulty balancing and had to hold on to my husband’s arm for support and walk very slowly. I even had trouble thinking and talking, and I definitely could not drive myself to the laboratory.
The blood test revealed that my FT3 was 4.4 pmol/L (3.5-6.5), my free T4 was undetectable as it had been for the previous 3 years on monotherapy, and my TSH had skyrocketed up to 15.0.
When my doctor sent me the results, I realized that my transition from Cytomel T3 to a compounded version of T3 had put me on a lower potency version of T3 hormone for the past 6 months, and I had begun to feel increasingly hypothyroid over those months with symptoms such as peripheral neuropathy and slow healing of bruises and wounds, and a lingering infection.
After my blood test, I took my next dose immediately (I normally divide my monotherapy into five doses per day), and I was back to feeling normal within 4 hours. Subsequently, my increase in dosage raised my daily T3 dose by 25%, a T3 test confirmed that my T3 had gone back to its optimal level near the top of reference 12 hours post dose (where it needs to be when there is no T4 in circulation), and my months of lingering symptoms were gone in a couple of weeks.
The similarities between the bisoprolol side effects and the insufficient T3 (for a person on monotherapy) in blood prior to my lab test seem to point to a similar syndrome of insufficient T3 signaling.
Tania S. Smith
Thanks so much for your great article.
Please tell me what is “compounded version of T3”, is it T4 + T3?
Hi Vera. It is 100% T3 liothyronine. It just means it comes in a powdered form in a capsule from a special pharmacy that is licensed to compound medications. I can get customized dosages that fit my five times a day dosing schedule, instead of splitting tablets into half or quarter sizes. Some people with allergies order customized fillers.
Hi Tania. I am very sorry that you have suffered because of the poor performance of the pharmacy.
[…] In Anderson’s 2020 article, the research team’s focus was on atrial fibrillation risk at various levels of FT4, TSH, and FT3. (See our review of their article: “Anderson, 2020: Thyroid hormones and atrial fibrillation.” […]
I’d like to read a discussion about how high T4 levels on T4 monotherapy affect liver enzymes. I have to to be dosed over the range on Levothyroxine to be functional and get T3 into top 20% but it clearly triples liver enzymes. No one is discussing this flaw in T4 only. To function normally on T4 only must I compromise my liver health? Adding T3 places no burden on the liver and I experienced this with DTE. DTE significantly decreased liver enzymes despite taking up to 18 mcg of T3. In regards to AF,I experience heart palpitations with low levels of T3.
JrBorenz, thanks for your request for the topic of liver enzymes.
Which enzymes have you found tripled, and is it in your own experience or in the scientific literature that you saw it happen? Thanks also for sharing your experiences with liver and DTE (desiccated thyroid), and cardiac symptoms with lower T3.
Have you looked into the few incidences of liver toxicity for levothyroxine? There are some publications out there. Ohmori et al, 1999; Kawakami et al, 2007; Kang et al, 2015; Hlaihel and Al-Khairalla, 2019; Wu & Xie, 2019; Yu et al, 2019. See also the chapter on Thyroid Hormone in the online book “Liver Tox” by the National Institute of Diabetes and Digestive and Kidney Diseases.
[…] #9. Anderson, 2020: Thyroid hormones and atrial fibrillation. […]
[…] See our article that focuses only on the atrial fibrillation (AF) data set. […]
[…] Not every low-TSH state carries the same level of health risk. If you look at the FT3:FT4 ratios in Anderson and team’s large study, you will see that the hormone levels AND the ratio between the two hormones combine to affect risk of thyrotoxicosis. (See “Anderson, 2020: Thyroid hormones and atrial fibrillation“) […]
[…] Anderson, 2020: Thyroid hormones and atrial fibrillation – Thyroid Patients Canada […]