


OVERVIEW
SPINA-Thyr is a free diagnostic application developed by research endocrinologists who use it in peer-reviewed medical research.
SPINA-Thyr has been in development since the late 1990s under the leadership of Dr. Johannes Dietrich, Specialist in internal medicine, endocrinology and diabetology, BG University Hospital Bergmannsheil, Bochum, Germany.
SPINA-Thyr’s algorithm has been evaluated in multiple clinical trials with thousands of patients. (1) Its findings correlate with a wide variety of diagnoses of thyroid disease. (2) An online slide presentation further illustrates the technical details and usefulness of the application. (5)
See the reference list below for citations showing its scientific grounding and clinical testing.
What does SPINA see that lab tests can’t see?
SPINA-Thyr takes thyroid laboratory test values TSH, Free T4 and Free T3 and performs calculations that enable in-depth evaluation of:
- thyroid gland function,
- abnormal pituitary TSH secretion rates, and
- net global T4-T3 conversion rate
It analyzes the relationships between the hormones in blood in comparison to what is normally found within the norms of human thyroid hormone metabolism and hypothalamus-pituitary response (the HPT axis).
Even if one or more hormones are within reference range at the time of testing, it sensitively detects distortions in the HPT axis that can be caused by:
- Illnesses and medications,
- TSH-receptor blocking or stimulating antibodies (TSAb, TBAb),
- Endocrine disruptors — which can disrupt pituitary TSH secretion, thyroid function, or deiodinase enzymes (D1, D2, D3) or transporters,
- T3-secreting thyroid nodules
- Genetics, such as DIO1 and DIO2 polymorphisms, or disorders not yet discovered.
Wide applications and limitations
It is used for people in two conditions only: People who are on
- No thyroid therapy, or
- T4 monotherapy
at the time of the lab test.
Any T3 dosing at levels higher than normal thyroidal T3 secretion, and even minimal T3 dosing within 12 hours prior to the lab test, will distort the results.
Anyone can download and use the software. The files and basic manual are posted on Sourceforge (1).
There is a “BSD” software license for the product. BSD licenses are a family of permissive free software licenses, imposing minimal restrictions on the use and distribution of covered software.
The license provides a medical disclaimer:
“SPINA Thyr is intended for usage in science and research. Use for diagnostical purposes or for decisions on the treatment of patients is on your own risk. We are not liable for possible clinical errors, or for bugs or damages to your device or software installation.”
(SPINA Thyr 4.2.0 for Windows 64-bit)
Interpretation of results requires knowledge of the patient’s history and clinical status at the time of the lab test.
Caution: Unusual results often require advanced knowledge of thyroid disease and thyroid therapy for accurate interpretation. As with any disease diagnosis, learning is lifelong. Learning is informed by a good knowledge of the biological mechanisms, research, and clinical practice on many cases over time. See the reference list.
Practical uses of SPINA
Before therapy
First of all, SPINA-Thyr is a very helpful diagnostic tool before any thyroid therapy is initiated. It can assess all aspects of thyroid gland function, TSH secretion and T4-T3 conversion, even if dysfunction is mild:
- How healthy is the thyroid gland’s response to TSH?
- Is it a hyperactive thyroid, normal thyroid, or a poorly functioning thyroid?
- Is TSH secretion normal given their T4?
- Is something hindering or inflating T4-T3 conversion?
In cases of subclinical hypothyroidism, pre-therapy, SPINA software can distinguish true hypothyroidism from temporary TSH elevation in a person with a healthy thyroid and pituitary gland.
When TSH is abnormally high, it can help distinguish untreated primary hypothyroidism from TSH secreting adenomas that overstimulate a gland. With advanced knowledge its data could possibly discern TSH-receptor-blocking antibodies from syndromes of reduced receptor sensitivity to thyroid hormone (see the earlier post TSHR Antibodies can distort TSH secretion).
During thyroid therapy
It also provides diagnostic tools within the context of thyroid therapy.
In cases where T4 monotherapy is unable to resolve hypothyroid symptoms despite normalized TSH levels, SPINA can diagnose the degree to which a patient may benefit from T4 dose adjustment.
It can diagnose whether a patient is a poor converter of T4 hormone who may need T3 in their therapy to raise T3 to optimal levels in reference that effectively remove hypothyroid symptoms in a majority of patients. (8)
In T4 monotherapy, SPINA can also discern whether the TSH is a trustworthy guide to dosing, or whether TSH is responding abnormally to the level of T4. For example, mild hypothalamus-pituitary dysfunction during T4 therapy may result in a lower TSH than is appropriate for T4 levels. Correct diagnosis may prevent underdose, which could occur if trying to “normalize” (raise) TSH secretion from a hyposecreting pituitary.
SPINA can also detect resistance to thyroid hormone (RTH) within the pituitary gland during T4 therapy. This is a consistent pattern of an abnormally high TSH given the level of T4.
T3-dominant therapies will distort SPINA results.
SPINA has limited use within the context of therapies that involve dosing of synthetic T3 hormone or desiccated thyroid.
It will not be able to calculate T4-T3 conversion (deiodinase efficiency) accurately because it cannot distinguish T3 from the dose on the one hand and T3 arising from thyroidal secretion and T4 conversion on the other.
Nevertheless, if T3 doses are very small, no higher than the average T3/T4 ratio secreted by a thyroid (i.e. 5-7 mcg LT3 + 100 mcg LT4 combo) and the patient still depends largely on T4, SPINA may still assess very unusual TSH responses to a patient’s T4 levels.
If dosing T3, always test 12+ hours post-dose. The SPINA algorithm does not account for the benign and predictable lab test anomalies found in synthetic T3 therapies. FT3 levels will be higher and TSH levels lower within the first 12 hours post dose. This is due to predictable fast absorption rate followed by higher metabolic clearance rates as FT3 upregulates both D1 and D3 enzymes that transform T3 into T2 hormone. Even if dosing 10 mcg of T3, the TSH secretion rate needs at least 12 hours to recover.
- See research review: Free T3 peaks and valleys in T3 and NDT therapy
The higher doses and ratios of T3 content, including desiccated thyroid, cannot be expected to have the same effect on the pituitary TSH as T4 monotherapy. The pituitary and hypothalamus express an unique receptor TR-beta-2, which is expressed nowhere else in the human body but in the cochlea and retina. This receptor is uniquely sensitive to even mildly high levels of T3 entering cells, regardless of concurrent lower FT4 levels.
T3 metabolites such as Triac (TA3 – an acetic acid metabolite) are more powerfully TSH-suppressive than T3 hormone itself because of the unique properties of TR-beta-2 receptors.
- See research review: When dosing T3, you get higher levels of Triac
STEP 1. Download to a desktop PC
Use a desktop PC computer to download the software from the address in the reference list (1). Download the brief user manual for future reference. This program works best on a desktop or laptop computer with keyboard.
You will need a full set of thyroid lab results: TSH, Free T3 and Free T4, because all three are used in calculations.
STEP 2. Enter lab ranges
This step is very important!
Click the “Edit” menu and select “preferences.”

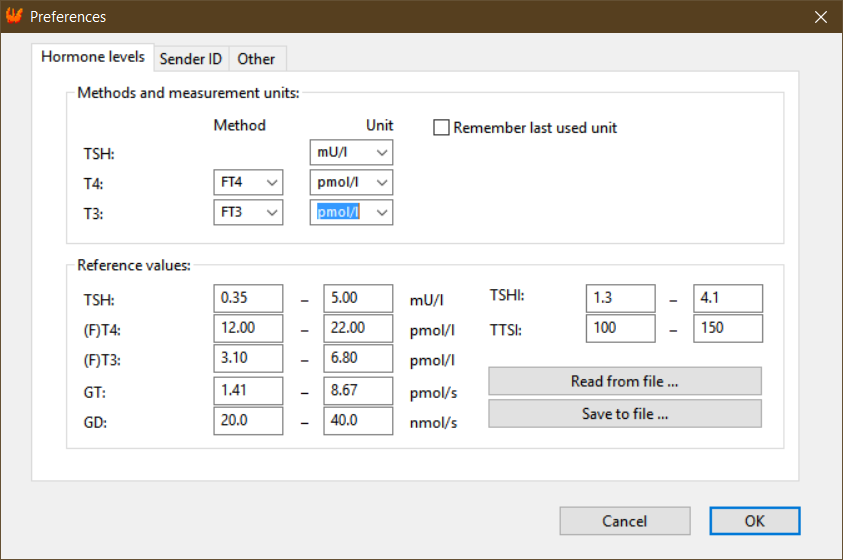
1. Enter the units of measurement from the laboratory for Free T3 and Free T4 — for example, ng/dL / pg/ml, or pmol/L for both.
NOTE: You can also choose to enter data for T3 (Total T3) and T4 (Total T4). However, Total T3 and T4 are not commonly measured anymore. Free T3 and Free T4 measurement is now the standard. Free thyroid hormone testing isolates the unbound hormone (not bound to carrier proteins like thyroxine-binding globulin [TBG], or albumin) and it is therefore the hormone available to enter cells. Of course, one may also measure Total hormones when Free results are very high or very low, to confirm what is going on with thyroid hormone secretion/absorption and binding.
2. Enter the lab’s reference ranges for TSH, FT4 and FT3.
Do NOT edit the reference values for anything else, since those ranges are built into the app.
When finished, press OK to return to the main interface.
NOTE: To obtain a more accurate GD, the FT3 and FT4 results may need to be adjusted.
SPINA results are based on Dietrich and team’s laboratory assay “platform” and reference ranges, not your laboratory’s platform and reference ranges.
As of the time of writing, SPINA does not yet adjust results based on your lab’s FT3 and FT4 reference ranges. (This may be part of a software update in future.)
To adjust one’s ratio to approximate the Roche assay lab ranges used by Dietrich and team, Thyroid Patients Canada provides a Google spreadsheet people can copy or download.
STEP 3. Enter lab values and calculate
After entering reference ranges and units, enter the lab results for TSH, FT3, and FT4 in the yellow fields.


- Select the “T4-substitution” checkbox if the person is on T4 therapy. Taking T4 hormone will make GT “not calculable” because T4 medication is not a thyroid gland.
- Leave all checkboxes empty if this person is not taking any medications.
- Click “Calculate.” You can close the pop-up window and still see the result.
When you hover a mouse over the results text, a small window will pop up with the reference ranges to aid interpretation.
To save a copy, you can download results to text and print it out or save it as a PDF by clicking the “File” menu, then “Print,” and selecting options. Or you can take a screenshot.
INTERPRET GT, GD, TSHI, TTSI
If a result is above or below reference, it will be marked with an asterisk.*
Use research-based knowledge to interpret results in the context of the reference ranges provided by SPINA-Thyr.
Whenever the results puzzle you, do your research and continue to learn. First consult the reference list below, and then look into other resources. Be wise and humble enough to admit it when you don’t know enough to interpret.
1. No thyroid therapy, GT: Functional thyroid capacity
- NOTE: GT will only calculate properly outside of thyroid hormone therapy. Above the results, verify that that you’ve correctly selected nothing or “T4-substitution.”
In subclinical hypothyroidism, judging by an elevated TSH with a T4 anywhere “within reference” alone is not enough to diagnose loss of thyroid function. Two lab 6 weeks apart, analyzed via SPINA, may confirm suspicion of permanently damaged thyroid tissue that is unable to secrete more T4 in response to elevated TSH.
The lower GT is more sensitive to low thyroid function than ultrasound calculation of thyroid volume.
In Hashimoto’s thyroiditis, the thyroid may or may not shrink or expand while losing GT. Fibrosis and death of cells that produce hormone will reduce the thyroid gland’s ability to respond to TSH stimulation, and therefore GT will be significantly lower, or low within reference.
If GT is high, it could be from Graves’ disease antibodies stimulating the thyroid, infectious thyroiditis, or a toxic thyroid nodule that is autonomously secreting hormone.
GT can be affected by iodine intake because thyroid hormones are synthesized by iodine; distinctive patterns appear with iodine deficiency and excess.
TECHNICAL INFO: the GT is the “calculated standardised estimate of the maximum possible T4 production per unit TSH. It is defined as the amount of T4 released per unit of time (pmol/s) at maximum glandular TSH stimulation.” (3) Therefore, it is primarily based on T4, the most abundant hormone product of the thyroid gland.
2. GD, efficiency of T4-T3 conversion
The software takes the Free T3 and Free T4 ratio and employs sensitive mathematical calculations.
- Reminder: Verify that that you’ve correctly selected no therapy or “T4-substitution.” This calculation will not work during T3 therapy or desiccated thyroid therapy.
Before thyroid therapy, in subclinical or overt hypothyroidism, expect GD to be higher to the degree that GT is lower and FT4 is lower. Increased secretion of T3 as well as increased conversion of T4 to T3 often maintains Free T3 levels to prevent the appearance of hypothyroid symptoms. However, when thyroid capacity drops too low within reference (if FT3 is too close to bottom of range or below it), the failing thyroid can no longer maintain healthy Free T3 levels and therapy is needed.
Outside of thyroid therapy, High GD can be inflated by high GT (T3-secreting nodules or Graves’ disease), so interpret them in light of each other.
Within T4 therapy, a low GD is a signal of impaired T4-T3 conversion. The lower the GD, the less T3 the patient is getting out of their T4 medication.
When T4 is high in reference range and T3 is significantly lower in range, the patient is more likely to have hypothyroid symptoms because of the reduced T3, despite a low or normal TSH.
To assess the GD a patient on T4-monotherapy, Midgley et al, 2015 defines three categories:
- “poor converter” <23 nmol/s (equivalent to a raw FT3:FT4 ratio of 0.25)
- “moderate converter” 23-29 nmol/s
- “good converter” >29 nmol/s. (4)
These apply only to people taking T4 meds alone.
TECHNICAL INFO: The Free T3:T4 ratio is the basis of this refined calculation by SPINA-GD. In technical terms, “SPINA-GD (GD) estimates the maximum global activity of peripheral step-up deiodinases per unit of time (nmol/s) from equilibrium levels of FT3, FT4 and constants for plasma protein binding, distribution and elimination.” (3)
Neither the GD nor the raw ratio are not sensitive to laboratory reference ranges and are only calculated based on absolute FT3 and FT4 results in pmol/L. However, the ratiometric calculation is still very sensitive because the index depends on two hormones in relationship to an absolute ratio’s population range in large populations. The average FT3:FT4 ratio in healthy populations is extremely narrow, equivalent to a raw FT3:FT4 ratio of 0.31 to 0.34, and varies little across sex and most ages.
- See research review: Normal FT3:FT4 thyroid hormone ratios in large populations
- Caution: See An example of confusion about Free T3: Free T4 ratios
Conversion efficiency is in large part reduced by loss of functional thyroid tissue, since the thyroid gland not only secretes T3, but converts T4 into T3 (this is the theory behind the “TSH-T3 shunt”). The rate of T3 secretion and conversion both increase with higher levels of TSH stimulation of thyroid tissue. Higher TSH may also enhance T4-T3 conversion beyond the thyroid wherever TSH receptors are present.
Conversion efficiency may be further reduced by genetic defects in DIO1, DIO2, (the genes that are the basis of Deiodinase Type 1 and Deiodinase Type 2) or the more severe syndrome of “partial SBP2 deficiency” (the gene has been renamed SECISBP2). Such defects can significantly reduce the effect of TSH-driven enhancement to hormone conversion. In DIO1, DIO2 and SBP2 deficiency, deiodinase type 3 is still able to deactivate thyroid hormone at a higher rate than normal, so chronic low T3 syndrome is a risk.
Doctors, please do not increase the T4 dose in a “poor converter” with low GD whose T4 is already high-normal. This can result in even lower T3 and/or adverse cardiovascular symptoms from excess T4. Why?
- Pushing the T4 level beyond a person’s set-point will decrease the action of the enzyme Deiodinase type 2 (D2) via ubiquitination, and increase the action of Deiodinase type 3 (D3). The role of Deiodinase type 3 is to convert T4 into Reverse T3 and convert T3 into T2, thereby causing a net result of T3 depletion.
- FT4 within the high-normal range binds to the integrin receptor on the surface of cell membranes in some blood vessel tissues, and it sends signals that T3 hormone does not send from this receptor.
A poor converter without enough thyroid tissue to supply T3 simply needs T3 therapy adjusted to optimize their Free T3 to a target at or above the average FT3 of a person with a healthy thyroid gland, according to Larisch et al, 2018. That’s an average, though, and each person is unique.
At the end of this article, I provide a discussion of the challenge of distinguishing illness-induced low GD from one caused by other factors.
3. TSHI: TSH Index
The TSHI (TSH-Index, reference range 1.3 – 4.1) tells you if the pituitary gland is secreting too little TSH in response to thyroid hormone, within normal functional parameters.
TECHNICAL INFO: In technical terms, the TSHI “estimates maximum pituitary TSH reserve by extrapolating the amount of TSH feedback inhibition for a measured FT4 concentration.” (3)
As one can see by varying the FT3 result to see its effect on TSHI, the index also takes into consideration FT3. However, the TSH secretion rate is not very sensitive to low or low-normal FT3 unless FT4 is also low at the same time. Therefore, if TSHI is low, consider other health factors besides FT4 that can lower or suppress TSH.
Low TSHI may be an indication of central hypothyroidism (secondary or tertiary hypothyroidism) — a compromised hypothalamus or pituitary gland. It could be from any cause, however, and either a sign of temporary pituitary interference or permanent pituitary failure.
SPINA-Thyr distinguishes all degrees of central hypothyroidism, from mild to severe. (See articles on the difficulty of diagnosing central hypothyroidism, and tips on central hypo diagnosis during thyroid therapy.)
- If secondary hypothyroidism is mild, TSH suppression could be temporary, perhaps caused by medications or substances that reduce TSH (such as corticosteroids), fasting (calorie-deficient or protein-deficient diets), or a severe illness.
- If the patient has moderate to excessive thyroid gland secretion and very low TSH secretion, this will also result in a low TSHI. It can make one suspect either:
- a) Graves’ disease (TSH-Receptor antibodies can stimulate the gland instead of TSH, and meanwhile, TSHR stimulating antibodies can interfere with the pituitary ultrashort feedback loop and trick the pituitary into lowering its secretion rate, see ref. 7 and our article outlining research on TSAb effects on TSH)
- b) Toxic thyroid nodules (which oversecrete thyroid hormone, often secreting more T3 than T4)
- c) Infectious thyroiditis (temporary thyroid gland inflammation and hypersecretion). See the example below.
- The TSHI calculation is based on the FT4-TSH relationship only, not FT3. It does not distinguish whether TSH suppression is caused by a higher FT3 level or by some other factor such as fasting. Therefore, one must manually evaluate the FT3 and the FT3:FT4 ratio to determine the degree to which higher FT3 is a cause of a low TSHI. In normal healthy subjects, FT3 is approximately mid-reference. TSHI will be lower to the degree FT3 is significantly higher than the population mean, even if FT4 is concurrently low-normal or lower.
- Normally, TSH is more powerfully suppressed by FT4 than FT3. If a person is taking T4 monotherapy and is a poor converter, their isolated low T3 is not capable of causing their TSH to rise. The pituitary is sensitive to the thyroid hormone that dominates, and in most cases, especially in T4 monotherapy, T4 is dominant. When T4 dominates, a lower T3 will be usually be ignored by the pituitary.
4. sGD and sTSHI
The “s” before GD and TSHI designates the “Standard Deviation” from a midpoint of reference ranges, betwen 2 SD below and 2 SD above the midpoint of reference. This value gives you an idea of how far above or below the reference midpoint the GD and TSHI are.


5. TTSI: Thyrotroph thyroid hormone resistance index
TTSI data can help diagnose Resistance to Thyroid Hormone (RTH) and other disorders that mimic it.
RTH means the thyroid hormone receptors in the pituitary gland require more T4/T3 than normal to stimulate them in order to bring down the TSH.
To the degree TTSI is significantly elevated (reference 100-150), a patient may have RTH. According to a clinical study by Pohlenz et al, 1999, cited in the SPINA-Thyr manual:
- Normal TTSI is 136 (reference 100-150)
- Mild pituitary-selective RTH = 308
- Severe pituitary-selective RTH = average 747
- Generalized RTH (even beyond the pituitary) = average 1559.
In RTH syndromes, the person has a biological requirement for higher Free T3 and possibly higher Free T4 levels than the normal levels found in healthy controls, at the upper limit of reference or slightly higher.
If TTSI is high, consult research publications and experts regarding therapy and do not trust TSH to indicate thyroid hormone (in)sufficiency.
In RTH, the therapeutic goal is not always to normalize the TSH with T4 medication because doing so may result in excess T4. Some tissues may become thyrotoxic while others may be euthyroid or hypothyroid, depending on the degree to which affected thyroid receptor variants are expressed in those tissues. Usually RTH affects thyroid hormone receptor beta (TRAB gene).
A high TTSI may also reveal other disorders.
- Recovery from nonthyroidal illness. The pituitary increases TSH stimulation on the thyroid gland to recover FT3, not necessarily because FT4 is low.
- TSH-receptor blocking antibodies in thyroid-disabled patients on therapy. In patients with autoimmune thyroid disease, either Graves’ or Hashimoto’s, or atrophic thyroiditis, pituitary-TSH “ultrashort feedback loop” (sometimes called the Brokken-Prummel-Wiersinga feedback loop) is subject to interference by two types of TSH-receptor antibodies, blocking and stimulating. This makes TSH-FT4 relationships abnormal in cases where thyroid function is impaired and patients are dosing T4. When the TSH-receptor blocking antibodies (TBAb) are active, the pituitary cannot sense its own TSH in circulation, so TSH secretion rate increases abnormally in relation to normal FT4 levels during thyroid hormone therapy. However, research on this effect is sparse (See ref. 10, Fan et al, 2014).
- Pituitary TSH hypersecretion may be caused by a pituitary adenoma (TSH-oma). This is very rare. If it occurs during thyroid therapy, a high TTSI would result. A healthy thyroid gland is required for an abnormally high level of TSH stimulation to cause hyperthyroidism (high FT4 and FT3) (ref 12. Beck-Peccoz et al, 2000/2019). However, if the patient does not have enough thyroid tissue for TSH to stimulate, the FT4 cannot rise along with the TSH stimulation, and the TTSI will rise significantly.
- A rare genetic condition called a “partial SBP2 deficiency” can also cause TSH to be abnormally high per unit of T4. In this case the reason is that T4-T3 conversion via D2 is significantly impaired within the hypothalamus and pituitary gland. This condition handicaps the SECISBP2 gene, which is responsible for forming the three deiodinase enzymes (D1, D2, D3) as well as glutathione peroxidase, from selenium. Such cases can be distinguished from “resistance to thyroid hormone” because the FT3:FT4 ratio may be abnormally low prior to therapy, and the TSH suppresses normally in response to T3 dosing. (See ref 11, Dumitrescu et al, 2008)
These TSH-FT4 anomalies will often become evident in the high TTSI in cases where TSH secretion is no longer in control of T4 supply from a thyroid gland.
NOTE: If TTSI is extremely low, it is usually because TSHI is low (subnormal secretion of TSH), and in this case the TTSI often reinforces or amplifies the TSHi.
EXAMPLE OF A PATIENT
An example can illustrate a rare and complicated case of diagnosis.
This screenshot (copied here from above) is from the laboratory results of a patient who was not on any thyroid therapy. (The reference ranges are in the “preferences” image.)
- The doctor had diagnosed thyroiditis, which seems likely given high GT.
- However, they had overlooked concurrent low pituitary TSH secretion (low TSHI, low TTSI).
- If the pituitary was healthy, the TSH should not have been suppressed given the patient’s T4 and T3 levels. As long as T4 levels are lower than those needed to suppress TSH, repeat laboratory testing and SPINA-Thyr analysis can confirm the abnormally low pituitary TSH secretion.
- If TSH secretion was lowered by medication or fasting or illness, it would not normally completely suppress the TSH.
- Graves’ disease antibodies may suppress TSH at the ultrashort feedback loop on the pituitary (7) and cause high GT. The patient’s T4 and T3 may not be able to rise above reference if the thyroid gland has been damaged from prior autoimmune attack.
- Graves’ TSH-receptor “blocking” antibodies (TBAb) can counterbalance TSH-receptor “stimulating” antibodies (TSAb) and result in net euthyroid hormone secretion from the gland: “The co-presence of TBAb and TSAb in the serum of a patient has been speculated to have a counteracting effect, similar to a tug-of-war.”(8)
In this case, it would be wise to test for Graves’ antibodies, either using a TSAb- specific assay or the TBII test which measures both types of antibodies together. If these antibodies are not present, thyroiditis combined with a hypopituitary diagnosis may be more likely. One would then test other pituitary hormone levels to see if they are lower than they should be.
UNCERTAINTY: LOW “GD” AND NON-THYROIDAL ILLNESS
If SPINA-GD (FT3:FT4 ratio) is low, suspect non-thyroidal illness (NTIS), which can result in severe loss of T3 (low T3 syndrome).
- Ataoglu: Low T3 in critical illness is deadly, and adding high T4 is worse.
- Low T3 effects on the cardiovascular system
- The impact of thyroid hormone dysfunction on ischemic heart disease, and how T3 therapy may help
- Low T3 thyroid hormone, insomnia, and sleep apnea
- Chronic fatigue syndrome and Low T3
- Low T3 syndrome in thyroid therapy: THREE studies
A chronically higher-normal FT4 and lower-normal FT3 is associated with chronic health conditions like heart failure and kidney failure.
According to the literature on non-thyroidal illness, the lower the T3 drops and the longer it remains low, the higher is the risk of continued illness and/or death, especially if a person becomes very ill.
Unfortunately, neither the low SPINA-GD nor raw low FT3:FT4 ratio distinguish basal poor T4-T3 conversion from decreased T4-T3 conversion due to nonthyroidal illness.
Therefore, the low SPINA-GD should be interpreted in the context of Total T3, Total T4 and if, available, Reverse T3 (RT3).


As shown above, Free T4 (and Free T3) may be higher than TT4 (and TT3) if circulating binding proteins (TBG, albumin, transthyretin) are abnormal due to illness (or due the common use of heparin, a porcine anticoagulant, in hospitals).
Therefore, if illness is suspected, test Total thyroid hormone levels and compare Free to Total T3 and T4 to discover any extreme disjoint. Then test blood and urine albumin and rule out T3 loss due to albuminuria (more T3 than T4 is bound to albumin).
The best metabolic index to detect NTIS is the RT3:FT4 ratio, not the T3:RT3 ratio. The latter ratio between the two metabolites exaggerates the statistics. The T3:RT3 index impressed scientists for a few decades until they realized its blind spots. The T3:RT3 ratio’s downfall is that it is not anchored in RT3’s only hormone of origin, FT4. The T3:RT3 ratio is also not indicative in kidney disease, which prevents RT3 elevation, or in thyroid hormone therapy, in which metabolic response to dosing or TSH-receptor antibodies can distort T3 levels even outside of illness.
The general principle is that in health, FT4 and generally RT3 echo each other’s position in reference range (13, 14).
However, it is reasonable to allow RT3 to be 20% of range higher or lower than FT4 to account for the fact that FT4 is a Free hormone fraction, and RT3 is a Total hormone measurement, higher FT3 can decrease RT3 via enhanced D1 enzyme clearance but the FT4 does not account for FT3, and the two hormone measurements are usually assayed on two different assay platforms with various reference ranges.
For example:
- Normal: FT4 at 50% of range, RT3 30-70%
- Normal: FT4 at 100% of range, RT3 at 80-120% of range
- NTIS: FT4 at 50% of range, RT3 >80%
- NTIS: FT4 at 100% of range, RT3 at >130% of range
What’s happening within cells?
- Deiodinase type 3 (D3) is upregulated by inflammatory cytokines and tissue hypoxia. D3 enzyme converts T4 to RT3, inflating the RT3:FT4 ratio in blood.
- When FT3 drops lower, RT3 will rise, because lower T3 signaling downregulates Deiodinase type 1 (D1), the enzyme responsible for most of RT3’s clearance rate.
- Therefore, RT3 appearance rises while RT3 clearance rate drops, keeping more RT3 in blood.
The recovery phase of nonthyroidal illness does not always occur. In thyroid therapy, low T3 can be chronic and induced by a combination of gland loss and genetically poor conversion capacity that can’t be compensated for by T4 monotherapy.
Recovery from low T3 syndrome in a person with a healthy thyroid usually happens in a sequence of events. First, the TSH will rise. This will stimulate extra T3 secretion from healthy thyroid tissue, thereby overcoming the higher rate of T3 inactivation. Later, metabolic enzymes recover, as shown in the decrease of RT3:FT4 ratio.
- If TSH does not rise, consider that it may not rise soon enough to help the patient recover their T3 levels and recover health. High-dose glucocorticoids and low calorie intake during hospitalization can also prevent TSH from rising.
- If TSH rises but there is not enough healthy thyroid tissue to stimulate a higher T3 secretion rate, we do not know what will happen to the average time to recovery or risk of death. This is because Thyroid patients are routinely excluded from low T3 syndrome (NTIS) research.
REFERENCES
(1a) To download:
Dietrich, J. W. (2019, April 26). SPINA: Structure parameter inference approach. Download from http://spina.sourceforge.net/ — the manual is at https://sourceforge.net/projects/spina/files/ — you may need to right-click files to download.
(1b) To cite the program in publications, use:
J. W. Dietrich (1994-2021). SPINA Thyr, software for structure parameter inference approach of thyroid function. RRID:SCR_014352. doi: 10.5281/zenodo.3596049. http://spina.medical-cybernetics.de
(2) Dietrich, J. W., Landgrafe-Mende, G., Wiora, E., Chatzitomaris, A., Klein, H. H., Midgley, J. E. M., & Hoermann, R. (2016). Calculated Parameters of Thyroid Homeostasis: Emerging Tools for Differential Diagnosis and Clinical Research. Frontiers in Endocrinology, 7. https://doi.org/10.3389/fendo.2016.00057
(3) Hoermann, R., Midgley, J. E. M., Larisch, R., & Dietrich, J. W. (2018). The role of functional thyroid capacity in pituitary thyroid feedback regulation. European Journal of Clinical Investigation, 48(10), e13003. https://doi.org/10.1111/eci.13003
(4) Midgley, J. E. M., Larisch, R., Dietrich, J. W., & Hoermann, R. (2015). Variation in the biochemical response to l-thyroxine therapy and relationship with peripheral thyroid hormone conversion efficiency. Endocrine Connections, 4(4), 196–205. https://doi.org/10.1530/EC-15-0056
(5) Dietrich, J. W., Fischer, M. R., Jauch, J., Pantke, E., Gartner, R., & Pickardt, C. R. (1999). Spinathyr: A novel systems theoretic approach to determine the secretion capacity of the thyroid gla. Retrieved January 1, 2019, from PowerShow website: http://www.powershow.com/view1/16f96d-ZDc1Z/SPINATHYR_A_NOVEL_SYSTEMS_THEORETIC_APPROACH_TO_DETERMINE_THE_SECRETION_CAPACITY_OF_THE_THYROID_GLA_powerpoint_ppt_presentation
(6) Hoermann, R., Midgley, J. E. M., Larisch, R., & Dietrich, J. W. (2018). The role of functional thyroid capacity in pituitary thyroid feedback regulation. European Journal of Clinical Investigation, 48(10), e13003. https://doi.org/10.1111/eci.13003
(7) Dietrich, J. W., Tesche, A., Pickardt, C. R., & Mitzdorf, U. (2004). Thyrotropic Feedback Control: Evidence for an Additional Ultrashort Feedback Loop from Fractal Analysis. Cybernetics and Systems, 35(4), 315–331. https://doi.org/10.1080/01969720490443354
(8) Larisch, R., Midgley, J. E. M., Dietrich, J. W., & Hoermann, R. (2018). Symptomatic Relief is Related to Serum Free Triiodothyronine Concentrations during Follow-up in Levothyroxine-Treated Patients with Differentiated Thyroid Cancer. Experimental and Clinical Endocrinology & Diabetes: Official Journal, German Society of Endocrinology [and] German Diabetes Association, 126(9), 546–552. https://doi.org/10.1055/s-0043-125064
(9) Fröhlich, E., & Wahl, R. (2017). Thyroid Autoimmunity: Role of Anti-thyroid Antibodies in Thyroid and Extra-Thyroidal Diseases. Frontiers in Immunology, 8. https://doi.org/10.3389/fimmu.2017.00521
(10) Fan, W., Tandon, P., & Krishnamurthy, M. (2014). Oscillating hypothyroidism and hyperthyroidism – a case-based review. Journal of Community Hospital Internal Medicine Perspectives, 4(5). https://doi.org/10.3402/jchimp.v4.25734
(11) Dumitrescu, A. M., Di Cosmo, C., Liao, X.-H., Weiss, R. E., & Refetoff, S. (2010). The syndrome of inherited partial SBP2 deficiency in humans. Antioxidants & Redox Signaling, 12(7), 905–920. https://doi.org/10.1089/ars.2009.2892
(12) Beck-Peccoz, P., Persani, L., & Lania, A. (2000). Thyrotropin-Secreting Pituitary Adenomas. In K. R. Feingold, B. Anawalt, A. Boyce, G. Chrousos, W. W. de Herder, K. Dhatariya, K. Dungan, A. Grossman, J. M. Hershman, J. Hofland, S. Kalra, G. Kaltsas, C. Koch, P. Kopp, M. Korbonits, C. S. Kovacs, W. Kuohung, B. Laferrère, E. A. McGee, … D. P. Wilson (Eds.), Endotext. MDText.com, Inc. http://www.ncbi.nlm.nih.gov/books/NBK278978/
(13) Massolt, E. T., van der Windt, M., Korevaar, T. I. M., Kam, B. L. R., Burger, J. W., Franssen, G. J. H., Lehmphul, I., Köhrle, J., Visser, W. E., & Peeters, R. P. (2016). Thyroid hormone and its metabolites in relation to quality of life in patients treated for differentiated thyroid cancer. Clinical Endocrinology, 85(5), 781–788. https://doi.org/10.1111/cen.13101
(14) van den Beld, A. W., Visser, T., Feelders, R., Grobbee, D., & Lamberts, S. (2006). Thyroid Hormone Concentrations, Disease, Physical Function, and Mortality in Elderly Men. The Journal of Clinical Endocrinology and Metabolism, 90, 6403–6409. https://doi.org/10.1210/jc.2005-0872