
My article published May 4, 2020, “Thyroid T3 secretion compensates for T4-T3 conversion” has received very strong positive feedback.
People are saying that it’s a ground-breaking, game-changing article on the HPT axis in health versus thyroid disease, and that it ought to be essential reading.
In a nutshell, my long article re-analyzes the published data set from a classic 1990 thyroid science article by Alessandro Pilo and team, supplementing it with insights from more recent thyroid science. What can we see?
- The data speak clearly through color-coded tables and graphs.
- They debunk the common mantra about the 20/80 origin of T3 hormone in the body.
- The standard claim is that, on average, our T3 supply arises from a 20:80 secretion to conversion ratio. The reality is more wide-ranging and diverse.
- The data reveal the flexibility of the healthy HPT axis.

I point out the obvious health implications of losing our healthy, flexible T3 secretion from a thyroid gland.
- Without a healthy thyroid, we can no longer compensate for shortfalls in peripheral T4-T3 conversion while on thyroid therapy.
- The detailed data are revealing, but the statistical averages in Pilo’s 1990 study are highly questionable, given the methodological problems with the study.
- The data clarify the harmful error of presuming that mere TSH normalization can ensure T3 sufficiency in a thyroid-disabled person on thyroid therapy.
That’s what the science and data reveal.
However, my full article is 3 pages long, with many tables of detailed data.
A colleague whom I respect, Paul Robinson, author of three excellent books on thyroid hormone therapy (see his website at paulrobinsonthyroid.com), has recommended that I provide an abstract or summary.
Wise advice! Thanks, Paul!
Therefore, here is the summary, a “Reader’s digest” version of the argument, with many images to feast upon.
Overview

Pilo’s 1990 study attempted to quantify the amount of T4 and T3 hormone secreted by the thyroid compared to how much T4 was metabolized to T3 throughout the body.

The study had key flaws in methodology and was limited by an incomplete, earlier understanding of the mechanisms of thyroid hormone transport and metabolism.
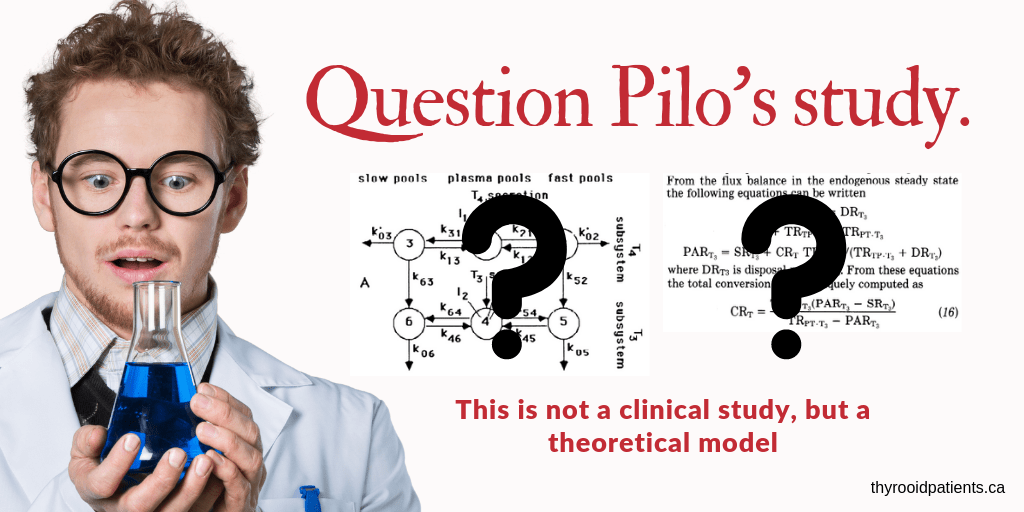
Despite these flaws and limitations of their study, the detailed data and estimates published in Pilo’s article are still enlightening today.
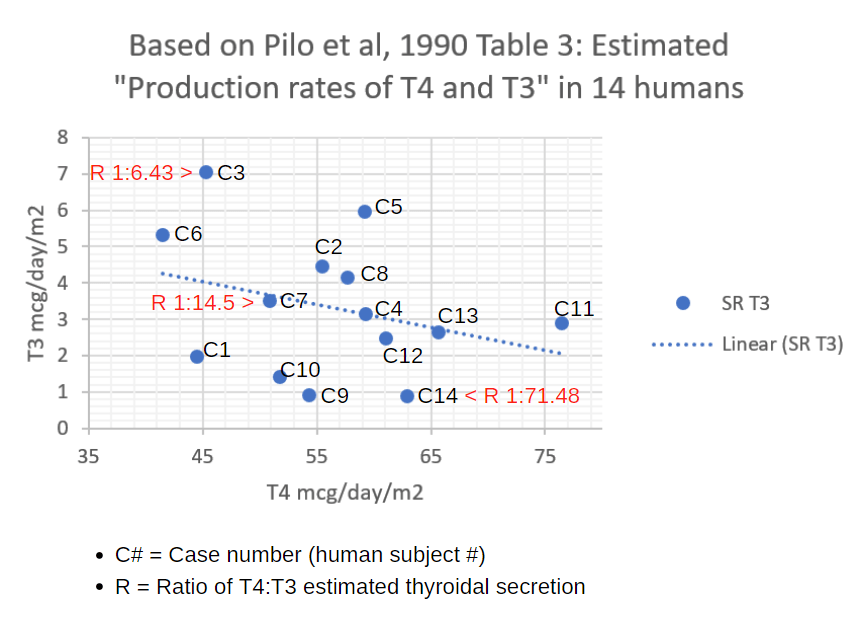
In Pilo’s data tables, they break down the data for each of their 14 human subjects, 9 men and 5 women.

These data, when analyzed by re-sorting by columns in the data set, reveal ten important principles and applications:
#1. The average T3 from secretion, 20% and average T3 from peripheral conversion, 80%, do not represent the full range seen among the 14 people.

The data ranged from 6.5% T3 from the thyroid gland to 42% from the thyroid gland. The statistical average of 20% was close to only one of the 14 people in the study.
#2. In the person who secreted 6.5% of their T3 from their thyroid gland, 93.5% of their supply had to come from peripheral conversion.

Clearly and obviously, in healthy people, conversion rate compensates for lack of secretion rate.
Each individual is unique in the population.

#3. If you remove the thyroid gland from the person who was secreting 42% of their daily T3 supply from their thyroid gland, in theory, you may steal up to 42% of the T3 their body needs.
Now their peripheral metabolism will supply 100%, but the 100% will represent a lower number of micrograms per day.

Can their metabolism make up for the loss?
Will the total amount of T3 in bloodstream be lower?
How much lower?
The TSH won’t tell you.

At any TSH level, the T3 of an LT4-treated patient can be lower than the vast majority of healthy people’s T3.
It all depends on the health of a person’s thyroid hormone metabolism: how well the individual can convert T4 to T3 without a thyroid gland.
Only recently have researchers begun to study our symptom burden and health outcomes when we are required to carry a low-normal or below-reference Free T3.
#4. The data show that people who have the least quantity of T3 in circulation are the ones who secrete the most from their thyroid gland, and vice versa.
However, the strong directly inverse relationship seen at the extremely low and extremely high end of T3 supply does not apply to the 7 people in the middle of the data set.
Once again, the generalizations about the data as a whole cannot apply to the individual within the population.
#5. The anomalies in Pilo’s data are explained by thyroid homeostatic flux.
Our healthy thyroid hormone economy must temporarily invert the standard relationship between secretion and peripheral conversion to raise or lower the total T3 supply in blood.
We need only look to our current scientific understanding of the healthy HPT axis (hypothalamus-pituitary-thyroid axis).
The thyroid hormone economy in an individual is capable of significant flux as the pituitary secretion of TSH raises and lowers our metabolic rate on demand. This does not happen very often.
As the body adjusts its T3 blood supply higher in response to demand, the relationship between secreted T3 and peripherally converted T3 will invert in relationship to the total supply.
More TSH will lead to more T3 secretion from the gland and relatively less peripheral conversion, and the total T3 in circulation will rise.
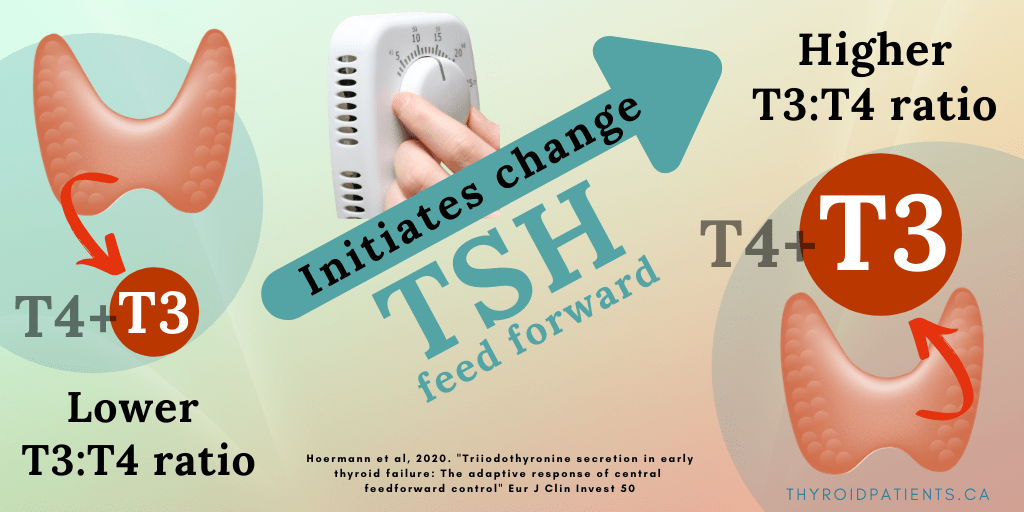
During an upward or downward transition, the thyroidal secretion rate will be abnormally higher or lower in relation to the total supply of T3 in blood.
But after the new homeostasis has been achieved, the the TSH-T3 state will normalize, and those with the largest T3 supply in blood will once again reduce their T3 secretion from the thyroid gland.
Negative feedback from T4 and T3 will lower the TSH at the new setpoint.
The “stasis” pattern of “the more T3 in blood, the less secreted from the thyroid” will prevail in the population at large. This is mainly because a larger number of people will be in a comfortable position of “homeostasis achieved” than the number of people in the process of a “metabolic transition.”
#6. If you remove the thyroid gland’s ability to raise its T3 secretion rate to raise T3 supply, you remove the engine that provides a patient with the metabolic flexibility they need to meet changing demands.
A person without a built-in “T3-pharmacy in their neck” can neither increase their T3 supply nor lower their T3 supply by means of fine-tuning TSH-driven T3 secretion from the thyroid gland.
Two areas of research in thyroid science show this:
Seasonal change demands T3.
New research on thyroid metabolic flexibility in seasonal change has shown that the thyroidless population maintained on LT4 hormone dosing alone cannot meet the demand for more T3 needed (and generated) in the colder winter season.
While the healthy population gains T3 in winter, the thyroidless lose a significant amount of T3 in winter if thyroid hormone LT4 dose remains unchanged.

LT4-treated thyroidless patients cannot keep up with the body’s demand for more T3 in winter because they cannot raise the T3 secretion rate from their thyroid, which is missing.
(These data come from Sicily, a Mediterranean climate. What would they be like in Canada?)
#7. Recovery from nonthyroidal illness demands T3.
The risk to thyroid-disabled patients is apparent in the research on mortality risk during “Nonthyroidal illness syndrome” (NTIS), also called Low T3 syndrome.
If you remove the thyroid gland, you remove the T3-secretion flexibility needed to recover from the T3 hormone deficit induced by NTIS.

In all human beings, regardless of their thyroid hormone health, a severe critical illness such as a heart attack can result in swift loss of T3 from blood as the body requires a swift reduction in metabolic rate.
During this temporary low T3 phase, the body is protected from undue energy expenditure.
It’s like a temporary state of hibernation.
However, at the point of recovery from NTIS, the point of the individual’s greatest T3 depletion, the TSH must rise to stimulate T3 repletion in proportion with a recovering T4-T3 conversion rate.
Recovery of T3 enables organs and tissues to heal.
Data show that patients with healthy thyroids whose T3 levels fall too low, who are unable to raise their TSH and replenish T3 supply, have a very high mortality rate.
Among those who recover, the TSH-stimulated increase in the rate of T3 secretion from the thyroid gland is the main engine that revives and restores the T3 supply in blood and reestablishes the healthy thyroid hormone economy.
In chronic illnesses like cancer, kidney failure, and heart failure, the mortality rate increases if their Free T4 is high at the same time that their Free T3 is low.

Thyroidless people (and those with inability to secrete enough TSH) lack this thyroidal T3 engine to recover from NTIS.
In addition, people who must take higher doses of LT4 will be burdened with a high-normal or slightly elevated Free T4 that increases their Low FT3 health risk.
But our vulnerable thyroid-disabled population has been excluded from almost all studies of NTIS.
Like Pilo’s study, researchers have only studied the healthy-thyroid population. They have only seen the NTIS metabolic flux and mortality risk in that population.

#8. Pilo’s data on TSH levels in relationship to FT3 levels shows no pattern or relationship at all.

This lack of TSH-T3 relationship is metabolically significant.
It reveals the driver of the metabolic flux we see in people who enjoy thyroid gland health. TSH is the driver of the shift from “metabolic transition” to the achievement of a new “metabolic homeostasis.”
But instead of trying to understand metabolic flux and disorder revealed in the data set between TSH and T3, many scientists decided to ignore the messy data.
Scientists decided to theorize an incomplete, simplified HPT axis model that omitted the most powerful and essential T3 hormone.
They chose to focus on the steady, standard, inverted relationship between TSH concentrations and T4 concentrations in blood.

Scientists also decided to simplify the model by emphasizing the statistical population reference range boundaries for TSH, T3 / Free T3, and T4 / Free T4.
This preference to judge euthyroidism by reference ranges emphasizes the statistical norms of the population.
It conveniently obscures the extreme diversity among individuals.
Research has shown that the Free T3 concentration has the narrowest range of movement up and down within the reference range over time.
Free T3 does not change much over time within a healthy individual.
In addition, Free T3 concentrations are the most diverse from one individual to another in health.

The messiness of TSH flux and T3 secretion/conversion compensation flux occur “behind the scenes,” not in lab test results.
Their flux is necessary to optimize and sustain T3 levels for the individual, since T3 is the most powerful thyroid hormone.
#9. Pilo’s data gives us insight into the influence of sex and age on T3 secretion and T3 conversion rate averages.
When his data is sorted by sex and age, the five females generally had the least T3 secretion from the thyroid, with the youngest secreting the most and the oldest secreting the least.

Among the nine males, T3 secretion rates were much higher on average, but the data was very inconsistent by age.
Pilo’s averages for the population as a whole are weighted toward the nine men.
With the exception of one man and one woman, on average the men had twice the T3 thyroidal secretion rate as the women.

The bias in Pilo’s data set makes it incorrect to generalize his statistical averages to the health of the thyroid-disabled population on thyroid therapy, most of whom are females over forty years of age.
It is time to re-do this study including both men and women at all ages.
We must also study a large population of people pre- and post-thyroidectomy to understand how T3 peripheral conversion adapts to the thyroidless state in all sexes and ages.
#10. Question the degree to which Pilo’s research subjects were truly healthy.
The research article did not rule out crucial features like
- mild central hypothyroidism,
- an undiagnosed chronic nonthyroidal illness,
- iodine excess or deficiency at the time baseline data was collected;
- nor the presence of supplements, medications and dietary factors that influence T4-T3 conversion rate.
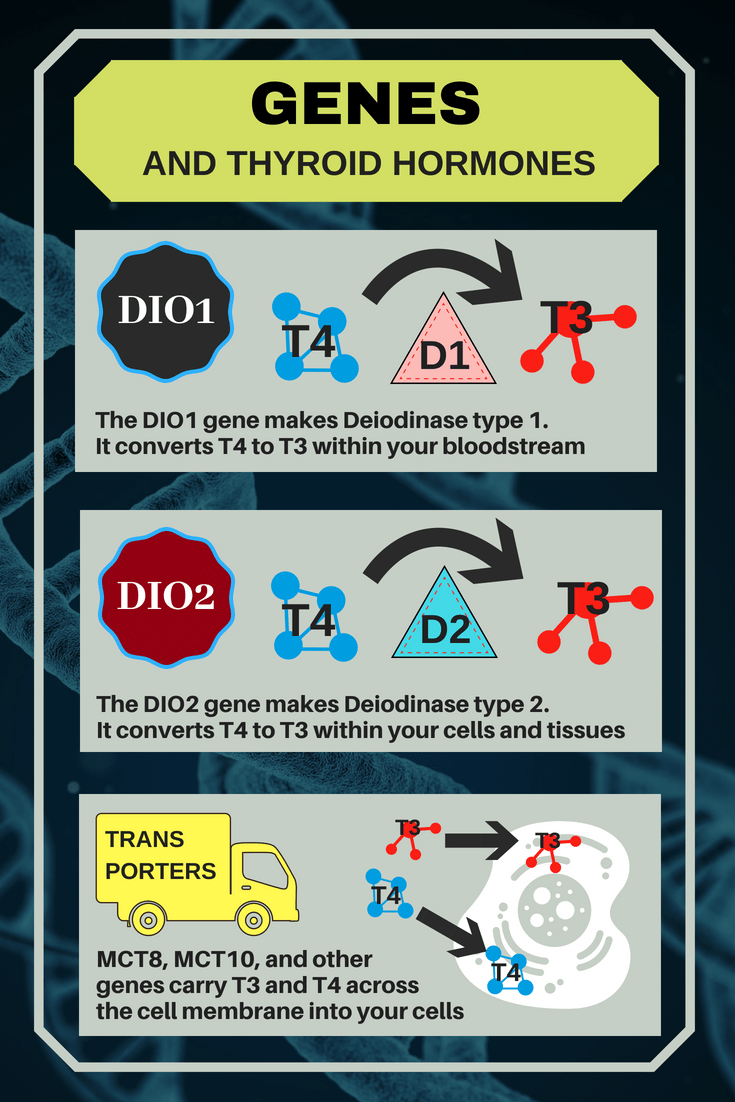
Pilo’s team performed research before the genetic revolution and could not test for polymorphisms in DIO1 and DIO2 that can significantly affect T3 levels and secretion/conversion ratios.
The study did not measure any biomarkers of T3 signalling throughout the body such as heart rate, cholesterol, ankle reflex, or bone metabolism.
Therefore, the study was unable to determine whether a person’s T3 supply from T3 secretion or or T3 conversion was truly sufficient for their body’s needs.
Solutions:
A. Respect T3 flexibility and diversity.


B. Change the mantra.
No longer claim that the thyroid secretes 20% of our T3 supply and the peripheral metabolism converts 80% of our daily T3 supply.

Change it to “A thyroid may secrete between 6% and 42% of total daily T3 supply to compensate for peripheral T4-T3 conversion rates.”
C. Study how to optimize each thyroid patient’s FT3 and FT4.
Pilo’s study says nothing about how to maintain health in a thyroid hormone economy that is no longer driven by the partnership between TSH and a flexibly secreting thyroid gland.
Yet his study is being misused to limit and oversimplify thyroid therapy today.

Pilo’s data prove that a programme of mere “TSH normalization” in thyroid therapy cannot flexibly adjust T3 levels in patients to meet their diverse individual needs or their changing metabolic demands.

The FT4:FT3 ratios represent those found in published research studies such as Gullo et al, 2011, “Levothyroxine” which examined 3,800+ healthy people’s levels and compared them with 1800+ LT4 treated thyroidless patients.]

Listen to the research already published on this topic.
Continue to perform more research on thyroid patients’ adaptation to metabolic stressors like nonthyroidal illness.
Read the full article
If you’d like to explore this article in further detail and have access to the references, here’s the link:
Leave a public reply here, on our website.