
Let’s take a thyroid hormone rhythm quiz to get into this article. It’s only two questions long, and both questions and answers are in this introduction.
Question #1. Which value varies the most during the day, a) TSH, b) Free T3 or c) Free T4?
If you chose a) TSH, you get a gold star!
The levels of all three hormones vary, but TSH varies the most widely over a 24 hour period. TSH varies significantly enough during lab testing hours to cause misdiagnosis, as I’ll show in the graphs from Russell et al, 2008 and another article.
Our medical system hasn’t stopped valuing TSH measurement just because it fluctuates more widely than Free T3 and Free T4 do. The circadian rhythms have some very practical implications for the timing of lab tests.
Question #2. Which thyroid hormone’s fluctuation is more variable from hour to hour, a) Free T4 or b) Free T3?
If you said “both approximately equal, with a very small bias toward FT3 fluctuation,” you get a silver star!
It’s time to dispel the ridiculous myths that it’s not worth measuring FT3 because results vary every hour or even every 20 minutes. The variance is not that huge.
Both FT4 and FT3 are almost equally variable as percentage of the mean, and FT4 varies far more than FT3 in its absolute number of pmol/L. I’ll provide overlapping color-coded graphs by Russell et al, 2008 so you can see what the variation looks like.
I’ll then use other research to show you how this variability contributes to a regular, constant pattern of lab history over weeks or months. A complete thyroid lab history reveals an individual’s narrow setpoint — their unique thyroid hormone fingerprint.
In fact, the relative stability of FT3 and FT4 over time can help give essential information, while misdiagnosis results from only measuring a tiny slice of the big daily TSH sine-wave.
For the advanced reader: Click to read about Russell’s research methods, aims, and laboratory test quality
Russell et al’s (2008) research methods

Russell and team measured TSH every 60 minutes, and FT4 and FT3 every 20 minutes in 33 healthy people over 24 hours.
In the 33 people who participated, “The mean (range) age was 22.8 yr (17.3–56.5), body mass index (BMI) 22.9 kg/m2 (16.3–28.9), and female to male ratio 9:24.”
Therefore, the sex ratio is very heavily weighted towards younger adults and men (72% male). All women were pre-menopausal and in the first half of their menstrual cycles. We can assume that most if not all of the 9 women were below the age of 50.
Only 29 of these people had their FT3 and FT4 measurements taken, but the researchers do not say whether the 29 people included a smaller percentage of women.
These people were taking no medication, had normal stimulation tests for ACTH and cortisol, growth hormone, and insulin tolerance. Their TRH-stimulated TSH response confirmed there were no signs of hypothyroidism, either central or primary, and they had no goiter. Thyroid antibodies weren’t measured, but the basal TSH and TSH-stimulated TSH ruled out subclinical hypothyroidism.
During the 24 hours of the test, the group were provided hospital meals at breakfast, lunch and dinner, and the patients were permitted to move around the hospital ward. Nobody was a shift worker.
Russell’s aim and assumptions
Strangely, the study was done “with a view to optimizing thyroid hormone replacement therapy,” but — nobody on thyroid hormone therapy was included in the study.
The mismatch between aim and method reveals two common, yet fallacious, assumptions.
- One is the idea that biochemical norms can be transferred from a non-thyroid-disabled population to a disabled and treated population and achieve the same health outcomes. It presumes a vital organ’s failure plus a pharmaceutical intervention will not cause fundamental, systemic changes, making the same biochemistry mean something very different to a different body.
- Another is the idea that treating an individual to fit the norms of a population is valid when each member of the population is so unlike another even in health, as even this study showed, and the studies it cites showed before it.
Fortunately, this ill-fitting aim does not spoil the core experimental design and analysis, which is to describe the circadian rhythms and patterns among TSH, FT3 and FT4 in a healthy subset of people. It only made them admit their conclusions were limited, and it ought to put any informed reader on guard.
Russell’s TSH, FT4 and FT3 assays were very sensitive and precise:
- TSH assay sensitivity: 0.005 mU/L, with a coefficient of variation (CV) at TSH levels of 0.028 mU/liter was 9.8% and at 0.5 mU/liter, 1.9%.
- FT4 assay sensitivity: 1.3 pmol/L, CV 6.6% at 6.1 pmol/liter and 3.0% at 13.9 pmol/liter.
- FT3 assay sensitivity: 0.3 pmol/liter, CV, 4.0% at 2.9 pmol/liter and 2.9% at 6.6 pmol/liter.
Generally, the FT3 assay used by Russell and team was more precise than the FT4 assay. As is usual, accuracy improved (lower CV values) with higher hormone concentrations.
In a 2010 article on the quality of Free T3 and Free T4 assays by an international committee (Thienpont et al, 2010), the standard limit of error for FT4 and FT3 assays is 11%. Russell’s assays performed well within that limit.
Most contemporary FT3 and FT4 assays are capable of achieving precision from test to test.
What did they discover across 29 to 33 people?
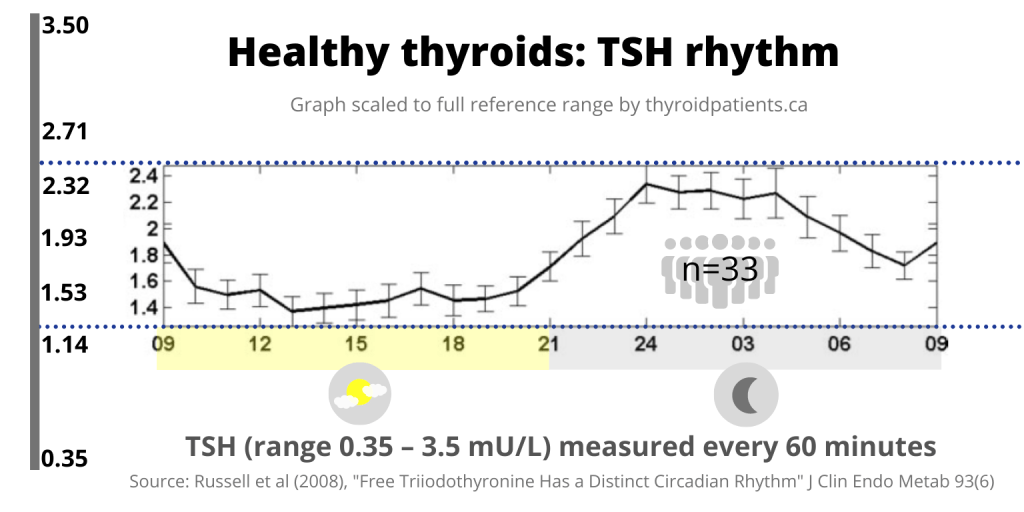
The data points: The bold horizontal line connects the average hourly values. The light gray vertical bars on the line are the range of standard error from the mean at each point of measurement.
The big sine wave: During standard laboratory testing hours, roughly 09:00 to 17:00, the average TSH level starts at 1.9 pmol/L at 09:00, then falls to its nadir (lowest point) by 13:00, and then remains fairly low. After 18:00, the average TSH begins to rise, peaking at 2.3 at 24:00 (midnight) remaining fairly high until 04:00, then it falls.
“there is a circadian rhythm of TSH with a peak level occurring at around 0240 h and levels remaining above the mesor from 2020–0820 h.”
(Russell et al, 2008, “Discussion” section)
The TSH’s mesor (24-hour midpoint) was 1.78 mU/L.
Scaled to reference range: Russell’s Y-axis to the immediate left of the line graph only showed the narrow portion of the range occupied by the data set. Therefore, I’ve scaled the graph to portray the line graph in relation to the full width of reference range, shown on the far left.

In a slightly smaller group of people (29 subjects), Free T3 was measured every 20 minutes. The FT3’s mesor (24-hour midpoint) was at 5.42 pmol/L.
“FT3 shows a circadian rhythm although with lower amplitude than TSH.”
(Russell et al, 2008, “Discussion” section)
The “Lower amplitude” is seen in the graph below, where the FT3 average curve (now in pink) is less deviated from a horizontal line than the TSH average curve is.

You can now see that the curve of the TSH and FT3 lines show that the FT3 is slightly delayed after the TSH curve.
“FT3 levels peak approximately 90 min after TSH levels at around 0404 h and remain above the median level from 2200–1000 h.”
(Russell et al, 2008, “Discussion” section)
The FT3 average rarely falls below the mid-point of reference range in these 29 healthy-thyroid people, while the TSH curve generally falls lower than the mid-point of reference range during laboratory testing hours.

You see I’ve had to shrink the FT4 graph in relationship to the laboratory reference range on the left to show where the graph fits within the that range.
Next, I’ve superimposed all three data lines, color-coded and lined up with their reference ranges.

Now the overlaid graphs enable comparison among the three hormones’ circadian rhythm and variability, both in relationship to their reference ranges and absolute values.
Diverse individual circadian rhythms and variability
In addition to giving graphs of average values among 29 to 33 people, Russell and team also gave two examples of individuals, one with high rhythmicity and one with low.

To enable comparison to the reference ranges, I’ve also color-coded each hormone’s data and superimposed them:

Subject #27’s variation and “strong rhythm” were nothing like Subject 34’s flatter lines of data:

It’s worth commenting further on this “weak” rhythmicity.
It is possible that Subject 34 had been fasting previous to the 24-hour study, given that the flattened TSH rhythm appears similar to that of Romjin et al, 1990

The weak rhythmicity is also suspect in the opinion of Jansen et al, 2015, who say that “Generally, these [circadian] properties of the hypothalamic-pituitary-thyroid axis are very robust in healthy participants unless
- the sleep-wake cycle is manipulated
- or in diseases including depression
- Alzheimer‘s disease,
- and metabolic decompensation in diabetes mellitus types 1 and 2.”
Variability of hormones over 24 hours
To quantify the three circadian rhythms from “most variable” to “least variable,” the researchers gave “the mean ± SEM (Standard error from the mean) percent relative amplitude (= amplitude/mesor x 100)” as follows:
- TSH = 36 ± 2.6%,
- FT3 = 5.6 ± 0.7%, followed by
- FT4 = 4.5 ± 0.6%.
The researchers also gave “the mean peak to nadir change as a percentage of the mesor” using the absolute numeric value of the mesor,
- TSH = 72%
- FT3 = 11.2%
- FT4 = 9%
Daily T3 fluctuations contribute to long-term T3 stability
When looking at the 24 hour rhythm in FT3 and the slight scatter of dots every 20 minutes on FT3 and FT4 waves, some may imagine that these fluctuations make testing these levels pointless.
However, FT3 is still remarkably stable and worth testing, as Abdalla and Bianco explain:
“Serum TT3 and FT3 exhibit minimal circadian rhythmicity that is due to a nocturnal increase in TSH secretion.
Otherwise, serum T3 is remarkably stable over periods of days, weeks or months in healthy adult individuals, despite a relatively short half-life (approximately 12–18 h).”
(Abdalla & Bianco, 2014)
The stability is seen in Ankrah-Tetteh, et al’s data set constructed over 6 weeks of measurement. Their data were derived from 4 men and 6 women, median age 21 years, range 19–27 years, a very young adult sample.

The “petals” of these individuals’ flowers are as wide and tall as the original whisker-plots were on Ankrah-Tetteh’s original graphs.
- Each flower represents an individual’s personal setpoint that remained steady over 6 weeks. The FT3 did not wander out of the pink zone, nor did the FT4 wander out of the blue zone.
- As TSH rises higher, it pushes the FT3 and FT4 higher. They do not become hypothyroid but instead, their metabolic rate likely rises.
- The Free T3 is rarely in the lowest 20% of the reference range.
- The Free T3 pink petals are larger than the blue FT4 only because the FT3 reference range is narrower (about 3.0 pmol/L) while the FT4 reference range is larger (usually at least 10 pmol/L, and the Y axis represents 100% of all three reference ranges.
- To put FT3 and FT4 variance in proper relationship to each other in pmol/L, you’d have to shrink the height of the pink FT3 petals to 1/3 their current size.
- TSH gray zones should also be shrunk in height in relation to FT4 because the TSH range is only 4.5 units wide on average.
TSH Circadian rhythm and misdiagnosis
Russell’s circadian rhythm study provides context for a study by Andersen et al, 2015 that pointed out the risk of TSH-based misdiagnosis.
They put TSH in the context of three other laboratory tests. They examined thousands of test results for TSH, Albumin, total Calcium, and Sodium. (Albumin is a serum binding protein often measured for liver function.)
Albumin was within the limits of allowable bias (shaded teal) but TSH quickly fell below the allowable bias (shaded pink) and then stabilized.
They found “a smaller variation in mean was observed for albumin, sodium and calcium (<3%) relative to TSH (28%),” and the TSH rhythm could result in “misclassifying” a patient as potentially hypo- or hyperthyroid.

In light of Russell’s graphs above, we can see that the nightly rise in TSH had not yet fallen until 9:00 AM, resulting in higher risk of misdiagnosis in the early hours (when overrelying on the TSH alone, of course):
“when comparing the morning (7–8am) with the afternoon (2–3pm), 6.2% of the patients were misclassified in the afternoon at the higher end of the reference interval (4.0 mIU/L) and 1.1% at the lower end (0.3 mIU/L).”
This clearly shows the diurnal effect (decrease in the morning followed by stabilisation).”
(Andersen et al, 2015)
To decrease misdiagnosis, interpret the test timing.
TSH variability occurs less during outpatient laboratory hours than over the full 24 hours, but that does not make TSH any less vulnerable to risk of misdiagnosis. One can’t predict whether a person has a strong or weak circadian rhythm.
A test taken at 9:00 AM in a person with a strong circadian rhythm is more likely to have not only a higher TSH, but also a higher FT3 and a mildly higher FT4 than a test taken at 3:00 PM. (See Subject #27’s circadian rhythm, above.) This is yet another strong reason why at least FT4 should be tested along with TSH when screening.
- Laboratories (or at least patients), should make a note of the time of the lab test, just as they do for a fasting blood glucose test.
- Whenever possible, one should always take the thyroid lab test at approximately the same hour of the day, such as 10:00-11:00 AM, to enable comparison from test to test.
Conclusion: The loss of clinical judgment
Many doctors would fail the simple introductory thyroid quiz.
Why have so many doctors been blinded to the biological insights revealed by circadian rhythms and fluctuations?
Why have so many doctors believed that FT3 varies more than TSH and therefore is too unreliable to bother to test?
Medical institutions have made it difficult, if not impossible, for intelligent physicians to develop their thyroid lab test analysis skills.
The mantras that invest blind faith in the laboratory statistics of the TSH number and critiques FT3 for its variability have nothing to do with true “evidence-based” medicine.
They are taught to repeat in TSH-monotesting mantras that boost the false belief in TSH’s exquisite sensitivity, thyroidal omniscience and omnipotence, and these beliefs reinforce the standard policy of FT3 and FT4 “evidence-denial.”
Once our penny-pinching campaigns succeed in making laboratories cancel FT3 and FT4 thyroid hormone evidence to support medical analysis, there will be no opportunity to investigate TSH-FT3-FT4 relationships in clinical context. Doctors and patients will be clouded in ignorance of these vital relationships — unless they inform themselves, or the system changes.
Continue to Part 2: The significance of the TSH-FT3 circadian rhythm
There’s even something more profound you can learn to build on this basic knowledge of circadian rhythm. It’s called “feedforward,” and I’ll talk about how it even supports human longevity.

References
Abdalla, S. M., & Bianco, A. C. (2014). Defending plasma T3 is a biological priority. Clinical Endocrinology, 81(5), 633–641. https://doi.org/10.1111/cen.12538
Andersen, I. B., Brasen, C. L., Christensen, H., Noehr-Jensen, L., Nielsen, D. E., Brandslund, I., & Madsen, J. S. (2015). Standardised Resting Time Prior to Blood Sampling and Diurnal Variation Associated with Risk of Patient Misclassification: Results from Selected Biochemical Components. PLoS ONE, 10(10). https://doi.org/10.1371/journal.pone.0140475
Ankrah-Tetteh, T., Wijeratne, S., & Swaminathan, R. (2008). Intraindividual variation in serum thyroid hormones, parathyroid hormone and insulin-like growth factor-1. Annals of Clinical Biochemistry, 45(Pt 2), 167–169. https://doi.org/10.1258/acb.2007.007103
Jansen, S. W., Akintola, A. A., Roelfsema, F., van der Spoel, E., Cobbaert, C. M., Ballieux, B. E., Egri, P., Kvarta-Papp, Z., Gereben, B., Fekete, C., Slagboom, P. E., van der Grond, J., Demeneix, B. A., Pijl, H., Westendorp, R. G. J., & van Heemst, D. (2015). Human longevity is characterised by high thyroid stimulating hormone secretion without altered energy metabolism. Scientific Reports, 5, 11525. https://doi.org/10.1038/srep11525
Roelfsema, F., & Veldhuis, J. D. (2013). Thyrotropin Secretion Patterns in Health and Disease. Endocrine Reviews, 34(5), 619–657. https://doi.org/10.1210/er.2012-1076
Romijn, J. A., Adriaanse, R., Brabant, G., Prank, K., Endert, E., & Wiersinga, W. M. (1990). Pulsatile Secretion of Thyrotropin during Fasting: A Decrease of Thyrotropin Pulse Amplitude. The Journal of Clinical Endocrinology & Metabolism, 70(6), 1631–1636. https://doi.org/10.1210/jcem-70-6-1631
Russell, W., Harrison, R. F., Smith, N., Darzy, K., Shalet, S., Weetman, A. P., & Ross, R. J. (2008). Free Triiodothyronine Has a Distinct Circadian Rhythm That Is Delayed but Parallels Thyrotropin Levels. The Journal of Clinical Endocrinology & Metabolism, 93(6), 2300–2306. https://doi.org/10.1210/jc.2007-2674
Thienpont, L. M., Van Uytfanghe, K., Beastall, G., Faix, J. D., Ieiri, T., Miller, W. G., Nelson, J. C., Ronin, C., Ross, H. A., Thijssen, J. H., Toussaint, B., & IFCC Working Group on Standardization of Thyroid Function Tests. (2010). Report of the IFCC Working Group for Standardization of Thyroid Function Tests; part 2: Free thyroxine and free triiodothyronine. Clinical Chemistry, 56(6), 912–920. https://doi.org/10.1373/clinchem.2009.140194
Leave a public reply here, on our website.