
Commonly, when scanning laboratory results, a physician will look for values that are “out of range” (high or low).
It is often presumed that if FT4, TSH, and FT3 are all “in the normal range,” those hormone levels won’t be a problem for the heart, the liver, the kidney, the brain, and so on.
It is often presumed that health risk only begins when these hormones, especially TSH, rise above or fall below the population’s reference range.
Fortunately, people can gain the courage to question false presumptions and faulty reasoning if they value truth as well as logic.
Sufficient scientific evidence exists for zones of thyroid hormone health risk and tissue thyroid hormone imbalances within the reference ranges, even if a person does not have a thyroid disease. When FT3 and FT4 are both normal, FT3:FT4 ratios are also biomarkers of risk.
Research often provides population-level data, but evidence of narrow, individualized thyroid hormone setpoints within the ranges should remind us that safe and healthy levels can differ from person to person. Tissue-level hypothyroidism or hyperthyroidism can occur if hormones rise or fall beyond our individual setpoints, even if levels remain within the population’s much wider range.
Fortunately, population distributions and biomarkers of tissue thyroid hormone status provide further insight. It also helps if we can think critically about thyroid symptoms before dismissing them based on biochemical normality.
Series summary: Cognitive barriers
This post is part of a series on the cognitive barriers to the analysis of untreated person’s normal-range TSH, FT3, and FT4 lab data.
- “Cognitive barriers to analyzing “normal” thyroid lab results“
- This post — “Are normal thyroid reference ranges risk-free zones?”
- “What’s wrong with calling TSH, FT3 and FT4 “thyroid function tests”?“
- “Can a normal TSH rule out thyroid disease?” Coming soon.
A cognitive bias is like a preference to go through one door rather than another.
A cognitive barrier means certain doors to deeper knowledge are locked or entirely hidden from view.
Any cognitive “bias” can become a cognitive “barrier” when it prevents one from examining the medical evidence that is right before their eyes – normal-range TSH, FT4, and FT3 lab data.
In the series introduction, I provided a comparison across medical fields. I outlined how scientists and policymakers in other diseases treat “normal range” values with great skepticism. In contrast, thyroid medicine tends to cling to the clinical and diagnostic significance of its normal reference ranges.
The first barrier (covered in this post) is the belief that “normal” range is a zone where thyroid hormones and TSH pose no health risk for any non-thyroidal disorders. For a long time, scientists have ignored non-thyroidal disease risk within the FT3, FT4 and TSH ranges because it is quite clear that very abnormal levels are riskier for untreated people than are normal levels, relatively speaking.
But science is now revealing that imbalanced yet normal thyroid hormones and TSH can negatively affect cardiovascular health, kidney health, liver health, and so on.
After this post, I’ll discuss why the common phrase “thyroid function test” is a cognitive barrier. It narrows the mind by narrowing the purpose of the test. It focuses on one corner of the HPT axis, the corner that is most accessible to examination and easiest to blame. But analyzing two or three hormones at once enables you to gain perspective, just as using two eyes instead of one enables you to judge depth and distance.
In the hands of an intelligent analyst, the TSH, FT4 and FT3 tests uncover the fine distinction between thyroid gland health and tissue thyroid hormone status, a distinction that is too often collapsed and misunderstood as being synonymous. They also help one evaluate pituitary (and hypothalamus) function as well as peripheral thyroid hormone metabolism.
The third barrier is the belief that a normal TSH has the power to single-handedly rule out almost all thyroid disorders except so-called “rare” pituitary disorders and thyroid cancers. But once you’ve gotten rid of the first and second barriers, this barrier to knowledge is much easier to get out of the way.
Physiology teaches us that a normal TSH is only as effective as the FT3 and FT4 reveal it to be. A normal or abnormal TSH may either fail or succeed at maintaining the untreated individual’s healthy thyroid hormone setpoint.
After the discussion of all these cognitive barriers, we must confront the paradox: Why is it part of evidence-based medicine to discourage physicians from analyzing the rich evidence provided by normal-range thyroid lab data? Some people pride themselves on being “evidence-based” when they are simply promoting or conforming to a programme of institutionalized thyroid ignorance within the normal ranges.
It’s time to stop making the upper and lower “limits” of the TSH, FT3 and FT4 ranges into the limits of medical understanding.
Not covering thyroid therapy optimization
In this series, I am not addressing the optimization of treated thyroid patients’ hormone levels within the normal range. That’s an incredibly complex topic. Many types of thyroid disorders exist and can overlap. Many treatment approaches exist. Disease and dosing will combine with genetics and nonthyroidal health conditions to alter a person’s optimal thyroid hormone setpoints.
Instead, I’ll be focusing on the lab data of untreated individuals who still rely on a TSH-stimulated thyroid for 100% of their thyroid hormone supply.
However, this topic is still relevant to thyroid therapy. Cognitive barriers to analyzing untreated people’s normal-range thyroid data are at the foundation of many thyroid therapy mistakes. If a doctor believes “normal” is safe and healthy in every untreated person, their cognitive barriers will also become barriers to optimizing thyroid therapy rather than merely normalizing their biochemistry.
Barrier 1. Normal range = no risk.
The first cognitive barrier is the belief that TSH, FT4 and FT3 levels within reference range constitute the lowest risk for any non-thyroidal diseases or disorders.
This way of thinking doesn’t just plague TSH, FT3, and FT4 interpretation. It’s a problem in many fields of medicine as physicians scan results, looking for analytes to be flagged high or low.
One of the best articles to help people overcome this cognitive barrier is Whyte & Kelly’s 2018 article titled “The normal range: It is not normal and it is not a range.” I’ll use several illustrations from their article in this post.
Whyte and Kelly first explain that the word “normal” is a common term that carries a lot of irrelevant, unnecessary baggage:
“The reference interval is an extremely useful means of contextualising a patient’s result but it is wrong to automatically assume ‘normality’ of a result within that interval, just as it is wrong to assume abnormality outside of the interval. Normality is relative and situational. ”
(Whyte & Kelly, 2018)
Why are some physicians and scientists willing to believe that normality is relative and situational in other diseases, but refuse to believe it applies to thyroid lab data?
Why shouldn’t certain TSH, FT3 or FT4 levels in the normal range be dangerous to health in certain sub-populations, like vulnerable people with diabetes or heart failure?
Many errors, if repeated over and over again, seem right just because they are familiar practices. This is the case with scanning lab results for high or low values and thinking that the normal ones are likely risk-free.
Scientists have familiar practices too. Decades of TSH health risk studies have blindly presumed that any value within the normal range has the default hazard ratio of “1.00,” when in reality there are varying degrees of risk within the range.
Recently, wiser researchers have turned their eyes to quantify the health risks for specific non-thyroidal diseases within these hormones’ reference ranges.
Zones of risk within the normal TSH, FT4 and FT3 ranges
In 2020, a large meta-analysis of many studies found that in untreated people, changes in FT4 and TT3/FT3 levels, even within the normal range are more clinically significant to nonthyroidal health conditions than changes in TSH.
Fitzgerald and colleagues’ article title was “Clinical Parameters Are More Likely to Be Associated with Thyroid Hormone Levels than with Thyrotropin [TSH] Levels: A Systematic Review and Meta-Analysis.” They wrote in their final discussion,
“the classification of thyroid function into normal, subclinical disease and overt disease is arbitrary.
Thyroid hormones … exert a continuum of effects across the normal range.
There is no clear border between normal and abnormal.
There are advantages and disadvantages associated with all levels.”
(Fitzgerald et al, 2020)
In addition, Fitzgerald’s review made an important critique of the current hormone hierarchy, in which the “abnormal vs. normal” TSH dominates and clouds judgment of “normal” FT3 and FT4 levels.
TSH hormone risk is unlike the FT3 and FT4 hormone risk. Even “abnormal” TSH levels do not carry as much weight as thyroid hormones do in determining health risk.
“Our work indicates that an abnormal TSH level per se is an imprecise indicator of tissue or organ hyper/hypothyroidism as compared with thyroid hormone [FT3, FT4] levels.”
(Fitzgerald et al, 2020)
Surprisingly in 2020, Anderson and team’s large study of thousands of untreated patients found that a TSH within the upper half of the laboratory’s reference range was often more strongly associated with disease than TSH values outside of range.
So much for an “abnormal” TSH being the first and key indicator of disease risk. It’s just not true.
This was the case for atrial fibrillation. Disease raw prevalence rates in people whose TSH levels in were in “Normal Q4,” where there was less risk for a TSH below range.
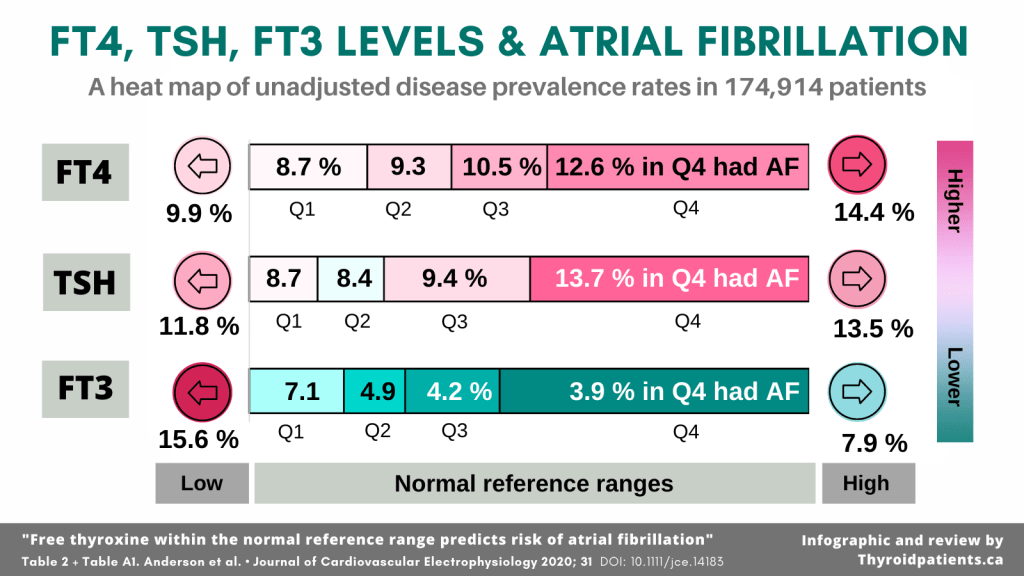
The adjusted hazard ratio for atrial fibrillation with a high-normal FT4 was 1.24, compared to 1.33 for an elevated FT4 (Anderson et al, 2020).
Moreover, Anderson’s data reveal that while low FT4 and low FT3 were both risky, as these hormones rose within the normal range, the two hormones’ risk profiles did not rise in parallel. Therefore, FT4 measurement is not a proxy for FT3 measurement. You can’t presume that a person with high-normal FT4 has high-normal FT3.
A similar heat map of colors shows up when combining rankings for four chronic cardiovascular diseases found in their appendix data set:

But despite all the wonderful insights one can gain from Anderson’s study, they revealed and strengthened certain cognitive barriers.
First, they decided to adopt the laboratory’s arbitrary 2.5th and 97.5th percentiles as boundaries between hormone level cohorts. Perhaps they felt that reference ranges were the most clinically familiar boundaries for their readers. But their methods acted on the common presumption that the statistical boundaries between normal and abnormal lab values were real physiological boundaries between health and disease.
Fortunately, their results revealed the contrary was true. Disease prevalence rates were not always higher outside the reference ranges for TSH and FT4.
Something in their chart looks very suspicious as well: the FT3 lower reference boundary is not likely the population’s turning point for disease prevalence because the risk jumps too extremely at this point. There is more likely a curve of increased risk between low-normal and low FT3 levels.
The lesson here is that a good physician, and a good researcher, should not presume that the outer limits of reference ranges serve double-duty as health risk thresholds.
Consider reference range population distributions
When looking at the median levels of TSH, FT3 and FT4, one can see that the medians are closer to the lower unadjusted disease prevalence rates in Anderson’s study.
Just look at the shapes of the healthy population’s distribution for free thyroid hormones and TSH in Ganslmeier and team’s well-screened population:

If all three hormone levels in an untreated individual are near their population medians, the chances are very high that their thyroid hormones are healthy and that they don’t have a thyroid or pituitary disease.
On the other hand, if all three hormones were far from the population medians, higher likelihood of health risk would exist, even if two or all three hormones fell within range. For example, in aging persons, the lowest quartile of FT4 is indicative of a progressively hypothyroid phenotype despite a “subclinical” zone TSH (Abbey et al, 2022).
Fitzgerald and team concur with the concept of the population median being significant, at least at the level of population health:
“any excursion from the middle of the range has an association with some pathology or other.
(Fitzgerald et al, 2020)
Some individual pathologies, for example, frailty, mortality, and dementia may increase with deviations either side of the middle of the range.
It seems likely that evolutionary mechanisms have arisen to minimize variation from the middle of the reference range of thyroid hormones.”
Statistical reference intervals and medians are rough aids to an assessment of health risk in untreated populations.
But just as there are reference intervals specific to children and specific to different weeks of a pregnancy, it is reasonable to expect the true physiological boundaries of health across different ages, sexes, and genetic profiles of healthy adults.
The research methods involved in determining the healthy population’s TSH reference interval (Ganslmeier’s distributions) are not the same as the research methods one would use to determine thresholds for excess or insufficient thyroid hormone supply to the heart, liver, kidney or brain (Fitzgerald’s review and Anderson’s study).
When ascertaining the normal reference range for a hormone, a research team is not investigating health risk, but simply describing the range of hormone levels in the healthiest population one can find. Categories that are based on descriptive statistics, such as “the 97.5th percentile of the population” are not health risk categories, although one can calculate an association with health outcomes.
Isolated hormone levels don’t usually cause risk on their own.
A lot of thyroid hormone health risk research, including Anderson’s, reveals a blind spot by what it forgets to measure.
A major cognitive barrier is to imagine that TSH, FT3 and FT4 levels work in isolation from each other and create health risk in isolation.
In Anderson’s study above, within each isolated TSH level cohort, there was a distinctive average FT4 and FT3 level. In each FT3 level cohort, including the lowest one, there was a distinctive average FT4 and TSH level, and so on.
The free fractions of both hormones — FT4 and FT3 — are both carried into the same cells and tissues side-by-side, and some transport proteins prefer to carry T3 more than T4, and others vice versa. Every minute of every day as T4 converts to T3, some T3 is also lost to T2.
For too long, FT3 has been left out of the assessment of the HPT axis, but it’s a highly potent free fraction and can speak volumes — mainly when it’s put in relationship to TSH and FT4.
This is why it’s a good thing that the the FT3:FT4 ratio is gaining ground in research as a biomarker. For example, look at these two titles:
- Hong, et al. (2022). Free Triiodothyronine and Free Triiodothyronine to Free Thyroxine Ratio Predict All-Cause Mortality in Patients with Diabetic Foot Ulcers. Diabetes, Metabolic Syndrome and Obesity: Targets and Therapy, 15, 467–476. https://doi.org/10.2147/DMSO.S354754
- Yuan, et al (2021). Usefulness of FT3 to FT4 Ratio to Predict Mortality in Euthyroid Patients With Prior Cardiovascular Events Undergoing PCI: Five-Year Findings From a Large Single-Center Cohort Study. Frontiers in Endocrinology, 12, 700349. https://doi.org/10.3389/fendo.2021.700349
The human body never interprets a FT4 level outside the context of a concurrent FT3 level and vice versa, so why should we?
No matter how much people want “one biomarker to rule them all,” in reality, hormone health and health risk comes in characteristic patterns or constellations of biomarkers. When measuring TSH, FT3 and FT4, one hormone level can’t always predict the other two, and any two can’t predict the third.
I hope more and more thyroid researchers will move beyond using only isolated hormone levels as risk biomarkers and consider ratios, as well as “risk phenotypes” consisting of constellations of TSH, FT3 and FT4 level relationships.
Narrow individual setpoints determine true “euthyroid” status.
At this point in thinking about health risk, we move from populations to individuals.
A good physician or scientist needs to be aware that the population reference ranges for TSH, FT3, and FT4 are far too wide to express the healthy zone for a hormone in any healthy individual.
In some biochemical analytes more than others, the healthy population’s range becomes very different from a healthy individual’s range of tolerance, as illustrated by Whyte & Kelly’s simple graph below.

Each healthy, untreated individual has a different narrow “setpoint” for TSH, FT3 and FT4, a narrow region within range that supports optimal organ and tissue function (Andersen et al, 2002; Karmisholt et al, 2008).
Now let’s look at 10 young adults’ TSH, FT3, and FT4 levels, color coded as gray, pink, and teal. Notice how stable their levels were over those weeks, and how diverse they were, when measured at the same time of day over 6 weeks.

Therefore, when both free thyroid hormones are low-normal (subjects 1, 2, 3, 5, and 6), they can cause hypothyroid symptoms in a person whose setpoint is high-normal (subjects 7, 8, 9, 10), even if their TSH is near the healthy population’s median.
Based on the understanding of individual setpoints within range,
- Low-normal FT3 and FT4 may be inappropriate and cause hypothyroid symptoms in an untreated, healthy person whose setpoint is high-normal (subjects 7, 8, 9, 10), even if their TSH is near the healthy population’s median.
- If an untreated healthy person’s free thyroid hormones are consistently low-normal like they are in subjects 1, 2, 3, 5, and 6, it may cause hyperthyroid tissue biomarkers if both were to rise to the high-normal range.
This graphic illustrates the fact that FT3, FT4 and TSH lab tests have what’s called a very low “index of individuality” (IOI) (Ankrah-Tetteh et al, 2008).
A similar experiment was performed by Andersen et al, in 2002 using TSH, Total T4 and Total T3 with monthly tests over 12 months, with similarly narrow individualized ranges.
A very low IOI significantly weakens medical confidence that any “normal” value is acceptable or healthy for the individual. For most analytes, the inter-individual variation (between individuals) is usually wider than the intra-individual variation (within each individual). But if the difference between the two is as extreme as it is for thyroid hormones the mere fact that a value falls within the population’s reference interval cannot be a judge of health for the individual.
Within a healthy individual, FT3 and FT4 rarely vary outside a region 10-30% of the width of reference range from week to week (Ankrah-Tetteh et al), and month to month (Karmisholt et al, 2008).
What is the key element in all the graphs on individual setpoints? More than one measurement over time. Each biochemical measurement is an isolated snapshot.
From a single measurement, one cannot tell if the hormones were in the process of moving from point A to point B, or if they have been at that level for some time and will likely continue to remain at that level. Two measurements, reasonably spaced, are twice as good as one, but only if a person takes the time to compare them.
Here’s another model from Whyte and Kelly (2018) revealing the clinical significance of comparing an individual’s change over time:

“Variation in the concentration of an analyte, if significantly outside of a patient’s usual values (but still within the reference interval), could be a sign of early or latent disease.”
(Whyte & Kelly, 2018)
Learning this lesson of individual variation may tempt many people to throw up their hands in exasperation. If the fact is that my healthy FT4 is not your healthy FT4, what can we do about it? The next two sections offer some answers.
Consider tissue-specific biomarkers.
This year, Jansen and team published a useful review of “Biomarkers indicating tissue thyroid hormone status.” I hope it is a sign that the assumptions about TSH and normal-range hormones are undergoing greater scrutiny.
Their article correctly pointed out that despite current reliance on thyroid hormone biochemistry and reference ranges, we still have an incomplete grasp of tissue thyroid hormone status.
“Currently, measuring serum thyroid-stimulating hormone (TSH) and/or free thyroxine (fT4) is leading in establishing TH [thyroid hormone] status.
However, it can be questioned whether both TSH and/or fT4 entirely capture TH status throughout the whole body.”… “In clinical practice, it is assumed that serum TH [thyroid hormone, FT3 and FT4] concentrations reflect TH status in the tissues.
However, previous research in both humans and rats indicates that serum TH concentrations may not always correspond with tissue TH status.“
(Jansen et al, 2022)
Fortunately, multiple tissue biomarkers of thyroid hormone action can aid in the assessment of whether an untreated person has tissue euthryoidism versus dysthyroidism when hormones are within the reference range.
And fortunately, many of their biomarkers do correlate with relatively higher or lower FT3 / TT3 or FT4 levels.
None of these tissue biomarkers in isolation is a sufficient sign of global euthyroid, hypothyroid or hyperthyroid status. But several may combine to form a clinical picture:
- Liver: 8 biomarkers including cholesterol and ferritin,
- Cardiovascular: 7 biomarkers including NT-proBNP, a common test for heart failure,
- Bone: 6 biomarkers, including osteocalcin
- Skeletal muscle: Creatine kinase (CK)
- Intestine: Intestinal alkaline phosphatase
- Kidney: Creatinine
- Pancreas: HOMA-IR
- Non-organ-specific markers, such as copper, selenium, acylcarnitines, malondialdehyde, ischemia-modified albumin, and tyrosine.
(Jansen et al, 2022).
It is cost-effective when routine laboratory tests can shed light on the patient’s tissue thyroid hormone status. On the other hand, some tests may be less common and/or expensive. Therefore, their review gives opinions on the degree to which a given biomarker is effective at evaluating this aspect of thyroid status.
However, Jansen’s review is not comprehensive, by any means. Other studies have identified strong correlations between tissue thyroid biomarkers and low or high FT3 or FT4 levels or the FT3:FT4 ratio in untreated individuals:
- Blood cell count results (Dorgalaleh et al, 2013);
- Altered liver function tests (Ajala et al, 2013);
- Protein changes in urine (Masood et al, 2021) nephrotic syndrome (Li et al, 2019), and low Kidney GFR in hypothyroidism (Mariani & Berns, 2012);
- A high-FT4-specific association with platelet aggregation and platelet count (Mousa et al, 2009; Davis et al, 2018, Ijaz et al, 2018);
- Low CoQ10 in hyperthyroidism (Mancini et al, 2011)
Think critically about symptoms.
Usually a patient will present with symptoms from the start if significant tissue dysthyroidism is present despite thyroid hormones being within the reference range.
But I mention symptoms last only after measuring biomarkers of tissue hormone status. If I had mentioned symptoms first, some readers would have stopped reading due to a cognitive barrier.
Today, an overwhelming medical prejudice exists against admitting the testimony of the patient about their own body whenever it contradicts normal range thyroid hormone and TSH data.
Toft and Beckett pointed out the illogic and injustice of throwing out symptoms as relevant evidence:
“All healthy patients have a TSH level of 0.5 to 5.0. Therefore, all patients with a TSH of 0.5 to 5.0 are healthy.
Does it not occur to you there may be a slight flaw in this logic?
In most fields of science, we would also test the contrary, i.e. do all unhealthy patients have a TSH range outside 0.5 to 5.0?
If this test had been done in 1973, when the hormone test was first introduced, we know the answer would have been no, many patients present with numerous specific clinical symptoms (not just overweight and tired) but have TSH in the normal range.
How different the diagnosis of hypothyroidism might been, if this had been done before taking the TSH range as gospel and throwing out all the symptoms.”
(Toft & Beckett, 2003)
The final sentence in the quotation uses this phrase — “diagnosis of hypothyroidism.” It hints at the crux of the issue, a misunderstanding of language and concepts of thyroid status.
People commonly conflate several different things within the meaning of the single word “hypothyroidism.” Which of these things does it mean?
- The individual has an autoimmune thyroid disease, Hashimoto’s thyroiditis.
- The thyroid gland is hypofunctional.
- The hormone biochemistry looks hypothyroid.
- A state of tissue hypothyroidism exists, causing a degree of dysfunction in several bodily organs and tissues.
These statements arise from four major ways of defining thyroid status. (Four similar types of statements could be said about hyperthyroidism.) These four states may coexist, but they do not have to coexist.
The relationship between normal-range biochemistry (condition 3) and health risk caused by tissue-level dysthyroidism (condition 4) above is the topic of this article.
Condition 4, which causes health problems, does not depend on conditions 1, 2 or 3. Between #3 and #4, FT4 and FT3 hormones in blood are transported into cells where they may be metabolized before they engage in signaling.
Symptoms occur somewhere between condition 3 and 4.
Symptoms can be evidence of tissue hypothyroidism, regardless of the TSH level and thyroid function status.
One need look no further than central hypothyroidism (pituitary/hypothalamus failure) as proof that tissue hypothyroidism does not wait for a statistically “high” TSH level to give permission before causing thyroid symptoms.
Of course, there is a very high probability that TSH will be higher and FT4 will be lower in untreated individuals with tissue hypothyroidism. But that does not mean that a certain threshold of high TSH or low FT4 is a necessary cause or effect of tissue hypothyroidism in each individual.
Thyroid symptoms vary from person to person, but certain common patterns occur, and that’s why there are symptom scoring systems.
A new thyroid symptom survey instrument called ThyPRO is gaining popularity. However, I suggest it could be useful to look at symptom scores from a time before the TSH reference range became a cognitive bias dismissing thyroid symptoms within the reference range.
Although they are not free of conceptual biases either, I recommend looking at some older symptom scoring systems such as the Billewicz score — see this article:
- Kalra, S., Khandelwal, S. K., & Goyal, A. (2011). Clinical scoring scales in thyroidology: A compendium. Indian Journal of Endocrinology and Metabolism, 15(Suppl2), S89–S94. https://doi.org/10.4103/2230-8210.83332
“Wayne’s index” is for thyrotoxicosis (1959), and the “Billewicz score” is for hypothyroidism (1969).
However, the more recent scale for hypothyroidism, the “Zulewski score” (1997) was biased by diagnoses based on reference intervals for TSH, Free T4 and Total T3 and also by presuming all LT4-treated thyroid patients were “euthyroid.”
Summary
One cannot rule out health risk or symptoms of tissue hypo- or hyperthyroidism within the reference ranges of TSH, FT3 and FT4 hormones. Health risk always exists across a continuum that includes the normal range.
Risk within the reference range varies by population subtype (i.e. by age, sex, chronic disease type) and between any two individuals.
To determine an individual’s thyroid hormone health risk and tissue thyroid hormone status, consider multiple lines of evidence:
- Consider research studies of disease associations with FT3, FT4 and TSH levels within the reference range in untreated individuals, i.e. atrial fibrillation is associated with a high-normal FT4 and high-normal TSH, but not a high-normal FT3.
- Likelihood of health risk may be predicted partly by the distance away from the medians of the healthy population distribution.
- One should not judge hormones in isolation from each other. Hormone ratios may also articulate risk.
- Patterns of consistency may exist within a person’s narrow individualized setpoint over time vs. significant changes in FT3 or FT4 over time.
- Tissue biomarkers may confirm suspicion of tissue dysthyroidism, especially if hormones are far from their population medians.
- Clinical symptom scores discussed in research literature can either help interpret lab data or begin the process of data collection. However, consider the research methods and criteria for confirming which symptoms are “truly” associated with hypothyroidism or hyperthyroidism.
References
The reference list for this series is in a separate post: “Reference list for analyzing normal thyroid lab results”
Leave a public reply here, on our website.